3Q 2015 Investment Letter

As an investment advisory, we feel investors should have an information outlet for the financial markets that is thorough, but does not require a prerequisite degree in economics. We intend for our quarterly commentary below to be informative and educational for investors at all levels.

Quarter in Review

The dark clouds that rolled in on the stock market earlier this year proved to be a telling warning sign as storms erupted on Wall Street in August. During the 3rd Quarter 2015, the U.S. stock market turned in its worst quarter in 5 years, with the S&P 500 posting a return of -4.9%. The market also became considerably more volatile, at one point declining nearly 10% in a week. The VIX, a measure of stock market volatility that is often called the “fear gauge,” jumped more than 200% in that same one-week period.

In looking for the culprit of these declining market returns, the finger continues to point overseas, especially to China, where their equivalent to the Federal Reserve decided to cut interest rates and also devalue the currency in the same month. The takeaway of those actions was that China’s troubles might be worse than initially expected.

The U.S. Federal Reserve met in mid-September, with most economists believing this meeting would mark the end of zero-interest-rate policy. However, in a near unanimous vote, the governors and chairwoman Yellen voted against a raise in rates–citing continued weaknesses in wage growth and lack of significant inflation. The FED’s belief that low interests rates are still needed to strengthen the economy was validated by a weaker-than-expected labor department report in early October, making the timing of future rate hikes more questionable.

Outlook

The economic conditions during the first three quarters of 2015 have been more favorable to some companies than to others. A good way to see this is to compare indexes of value stocks and growth stocks. Value stocks are priced less expensively than the average company, whereas growth stocks are more expensive because these are companies that are growing rapidly (full explanations of each are included in the glossary).

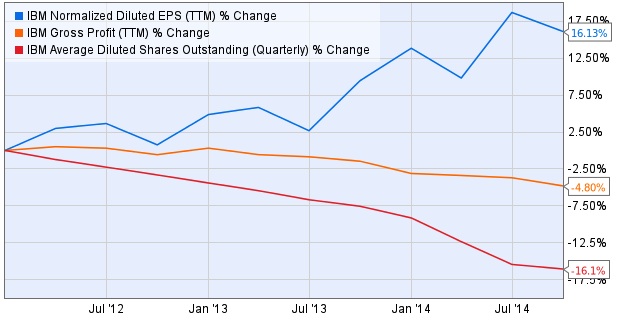
Over long periods of time, value stocks tend to outperform growth. However, growth stocks have often shown short periods of significant outperformance. This year has been one of those periods as illustrated by the chart below.Chart1 WC 3Q Commentary
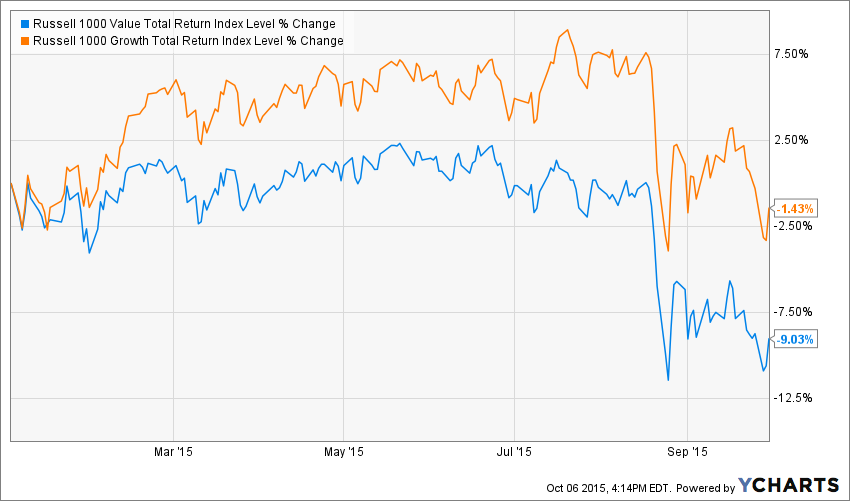
The growth index has large allocations to industries like biotechnology, Internet, and retail companies, which have benefitted from low interest rates and little obligation to produce near-term profits. The value index in comparison has high allocations to sectors that sputter with low interest rates, such as banks and insurance as well as energy, which have been depressed along with low oil prices.

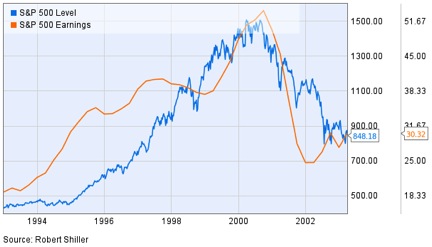
If economic forecasting and history play any role, value is beginning to look increasingly attractive. With the Federal Reserve eyeing a rise in interest rates within the next 6 months and the supply of oil dropping, the value headwinds look to be subsiding. In addition, periods of growth leadership have historically been fleeting, followed by sharp reversals and years of underperformance as seen in the chart below.Chart2 WC 3Q Commentary
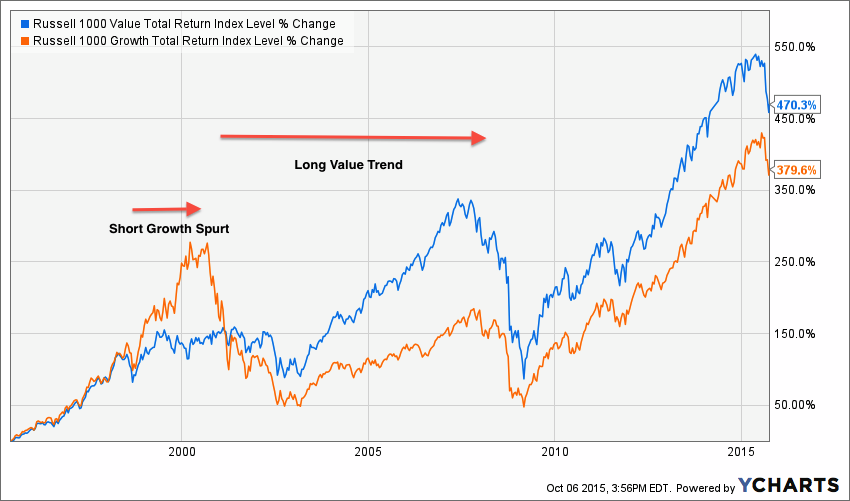
Hindsight is 20/20–if the technology boom of the late 1990’s taught investors anything, it is that irrational overpaying for stocks can last longer than is appropriate. Growth stocks may have months or even years of outsized returns, but a prudent investor can avoid surprises with a diversified portfolio of the sexy high-fliers and the steadfast yawners.

Glossary

Growth Investing – Focus on stocks that are growing sales and earnings at a higher pace than other stocks. Investors are typically willing to pay a higher price for growth stocks, leaving them susceptible to sudden drops.

Value Investing – Focus on stocks that are cheaper on a per-share amount of sales or earnings. In many instances value stocks are former growth stocks that have reached maturity without a catalyst for future growth.

IMPORTANT INFORMATION

The information presented here is not specific to any individual’s personal circumstances.

To the extent that this material concerns tax matters, it is not intended or written to be used, and cannot be used, by a taxpayer for the purpose of avoiding penalties that may be imposed by law. Each taxpayer should seek independent advice from a tax professional based on his or her individual circumstances.

These materials are provided for general information and educational purposes and represents Wilson Capital’s views based upon publicly available information from sources believed to be reliable—we cannot assure the accuracy or completeness of these materials. The information in these materials may change at any time and without notice.

Wilson Capital is a Registered Investment Advisor (“RIA”), registered in the state of Massachusetts. Wilson Capital provides asset management and related services for clients nationally. Wilson Capital will file and maintain all applicable licenses as required by the state securities boards and/or the Securities and Exchange Commission (“SEC”), as applicable. Wilson Capital renders individualized responses to persons in a particular state only after complying with the state’s regulatory requirements, or pursuant to an applicable state exemption or exclusion.

Click here to download the Investment Letter PDF: 3Q15-Investment-Letter-FINAL.pdf (577 downloads )


2015 2Q Investment Letter

As an investment advisor, we feel investors should have an information outlet for the financial markets that is thorough, but does not require a prerequisite degree in economics. Thus we have included a glossary of terms at the end of this commentary.  Each term with an asterisk has a corresponding definition in the glossary. We hope this makes our commentary informative and educational for all levels of investors.

Quarter in Review

During the second quarter of 2015, the U.S. stock market returned a modest gain with the S&P 500 up 0.3% while the bond markets took a hit with the Barclays Aggregate index returning -1.7%. These results are indicative of undercurrents of the U.S. economy. On the stock side, corporate profits stay muted as share buybacks and cost cutting measures remain the path of choice for executives looking for earnings growth. On the bond side, continued improvements in the job market and low inflation increase the probability that the Fed will raise interest rates before year-end.

While the 2nd quarter was relatively benign in the U.S., the investing world became fixated on the Greek Financial Crisis and the Chinese stock market crash, both of which were reaching a peak at quarter’s end.

The crisis in Greece has been developing for years as an overwhelming debt load hamstrung the country. As part of the Eurozone*, Greece’s actions have direct implications to other countries who use the Euro as their currency. Without a clear path to economic recovery and with unemployment approaching 30%, newly elected Prime Minister Alexis Tspiras rejected overtures from the IMF and other creditors to increase austerity* measures in order to engage in risky negotiations with creditors over more favorable debt repayment terms. As the quarter came to a close, the fear of Greece leaving the European Union hit a fever pitch sending European stocks plummeting. The crisis finally reached a tipping point with Greece defaulting on a loan given by the International Monetary Fund (IMF)* and Greece very recently agreeing to the austerity measures it earlier tried to reject.

The situation in China is in many ways the opposite of that in Greece. From August 2014 until Early June 2015, the Shanghai stock market index rose more than 130%. Overconfident small investors, an abundance of leverage, and a Chinese government eager to promote economic growth all worked together to fuel this massive gain. The party came to an abrupt end at the close of the quarter as stocks on the Shanghai index lost over 20% in a short two weeks.

Outlook

Given the events in the Europe and Asia during the past quarter, it could be taken as an encouraging sign that the United States is not directly involved with either problem. However, that doesn’t necessarily mean the U.S. economy or financial markets are immune from these issues.

Perhaps the single trait that investors crave is a sort of optimistic clarity. Whether it is real–for example in the form of the unexpected positive employment numbers in the U.S., or if it is perceived, in the form of a company promoting the next big idea 10 years in advance–both have the power to push markets higher.

Unfortunately, storm clouds have moved in on the markets raising the uncertainty of future market conditions. A year ago, few would have predicted that oil would drop over 50%, that Greece would default on a government loan, or that the Chinese stock market would create a bubble and burst. All three incidents are recent examples that throw curve balls to the financial analysts and economists, who would prefer long-term trends and consistency that fit nicely into their models.

Until these events play out, the double digit stock market returns that have become the norm in recent years may be put on hold. But, with current stock valuations reaching their highest levels since the bull market began in 2009, a breather may prove to be welcome relief.

Glossary

International Monetary Fund – An organization of 188 countries, that works to promote global financial stability

Short Selling – The act of borrowing shares of a stock and selling those shares. Short selling is a method of betting against a stock.

Austerity – Policy undertaken by a government to reduce budget deficits, typically in the form of higher taxes or reduced government benefits

Eurozone – Group of 19 countries tin the European Union that use the Euro as their currency.

IMPORTANT INFORMATION

The information presented here is not specific to any individual’s personal circumstances.

To the extent that this material concerns tax matters, it is not intended or written to be used, and cannot be used, by a taxpayer for the purpose of avoiding penalties that may be imposed by law. Each taxpayer should seek independent advice from a tax professional based on his or her individual circumstances.

These materials are provided for general information and educational purposes and represents Wilson Capital’s views based upon publicly available information from sources believed to be reliable—we cannot assure the accuracy or completeness of these materials. The information in these materials may change at any time and without notice.

Wilson Capital is a Registered Investment Advisor (“RIA”), registered in the state of Massachusetts. Wilson Capital provides asset management and related services for clients nationally. Wilson Capital will file and maintain all applicable licenses as required by the state securities boards and/or the Securities and Exchange Commission (“SEC”), as applicable. Wilson Capital renders individualized responses to persons in a particular state only after complying with the state’s regulatory requirements, or pursuant to an applicable state exemption or exclusion.

Click here to download the complete Investment Letter in PDF : 2Q-2015-Investor-Letter.pdf (720 downloads )


Pat Wilson, sponsored by Wilson Capital, takes on the US Open

WC Pat Wilson shot

Wilson Capital is proud to sponsor Pat Wilson as he competes in his first major championship during this week’s U.S. Open at Chambers Bay. We wish him luck competing against the best golfers in the world!

You can check out Pat’s Player page on the US Open site here.

Pat Wilson In the News, check back for updates:

June 16, New Jersey Herald: Andover’s Pat Wilson will ‘never forget’ 1st official practice round at U.S. Open

June 16, New Jersey Herald: Pat Wilson ‘indifferent’ on U.S. Open alternating pars for 1st, 18th holes


2015 1Q Investment Letter

As an investment advisory firm, we feel investors should have an information outlet for the financial markets that is thorough, but does not require a prerequisite degree in economics. Thus we have included a glossary of terms at the end of this commentary.  Each term with an asterisk has a corresponding definition in the glossary. We hope this makes our commentary informative and educational for all levels of investors.

Quarter in Review

During the first quarter of 2015, the S&P 500 stock index returned 1% while the Barclays Aggregate bond index returned 1.6%. The tepid returns, especially in the stock market, mask the high level of big day-to-day swings that occurred during the three months. To put it in perspective, the S&P 500 had 19 one-day swings in excess of 1% in the 1st quarter alone, compared to 38 for the entire year in 2014. These statistics reflect a market where investors are still finding their footing in a world of dramatically lower oil prices, lack of inflation, and stagnant corporate profits.

Perhaps the biggest economic story of the quarter involved currency, as the Swiss central bank suddenly decided to end their policy of pegging* the Swiss Franc to the Euro in mid-January. The results of this change proved that surprises are not a currency investor’s best friend, with stories of over-leveraged investors losing small fortunes splashing the financial headlines.

The quarter came to a close with some news that ketchup giant Heinz (owned by Warren Buffett’s Berkshire Hathaway) was buying Kraft Foods, marrying two kings of the packaged foods industry and adding 36% to Kraft’s stock price on the day of the announcement. Despite widespread studies showing Americans are increasingly shunning packaged and preservative-packed foods, perhaps the best investment advice is to pay more attention to what Warren Buffett is eating.

Outlook

Share Buy-Backs

According to a recent Wall Street Journal report, in 2014, 22 companies in the S&P 500 showed earnings-per-share (EPS) growth solely due to share repurchases. If you tuned out reading that last sentence I don’t blame you, as it sounds like a typical financial report headline heard on the nightly news. However, when we dig into this story, the content plays a significant role in what is happening in today’s economy.

Let’s break it down.

Every three months, companies release data announcing how the company performed in the prior quarter. Earnings-per-share is perhaps the most important number that companies release. Since companies are all different sizes and stock prices are for the most part random, the EPS number provides a standardized indicator of how much each company made in profits. However, unlike a gross number, EPS is an equation with earnings in the numerator and shares outstanding in the denominator. The company’s earnings are hard to fudge (unless that company is Enron), but the ‘shares outstanding’ number in the denominator can be manipulated by each company. As companies make money, they have several options for how to use that money. Some pay dividends, some reinvest in their company, and some choose a third option, which is buying back some of the company’s shares. Since investors place so much emphasis on meeting or beating EPS expectations, a lower share count can help that cause.

An example in action is below, with IBM’s recent move to aggressively buy back shares during the backdrop of decreasing profits.  As you can see, IBM’s EPS (the blue line) has grown in recent years because the percentage reduction in profits (the orange line) has been smaller than the percentage reduction in the number of shares outstanding (the red line).

1Q 2015 BuyBack Chart

While this action may help boost the paper gains* in investors portfolios (especially company executives) it does very little for the broad economy. A dollar spent on either capital expenditures for the company or dividends to investors offers a chance for that dollar to trickle through the economy and increase the wealth of all those who play a part.

Without a major increase in inflation rate or incentives for companies to expand their business, the era of the buy back may be something that is here to stay for some time.  While this trend may make companies and investors feel warm and fuzzy on strong performance, buy backs offer little more than a facade to their underlying results.

Glossary

Currency Pegging – Setting a fixed exchange rate of one country’s currency to another. Often used in countries that trade extensively in a particular country. An example includes the pegging of the Chinese Yuan to the US Dollar until 2005.

Paper Gain – Refers a gain from an investment that is still held. Paper gains show up on your statement, but haven’t been pocketed yet.

IMPORTANT INFORMATION

The information presented here is not specific to any individual’s personal circumstances.

To the extent that this material concerns tax matters, it is not intended or written to be used, and cannot be used, by a taxpayer for the purpose of avoiding penalties that may be imposed by law. Each taxpayer should seek independent advice from a tax professional based on his or her individual circumstances.

These materials are provided for general information and educational purposes and represents Wilson Capital’s views based upon publicly available information from sources believed to be reliable—we cannot assure the accuracy or completeness of these materials. The information in these materials may change at any time and without notice.

Wilson Capital is a Registered Investment Advisor (“RIA”), registered in the state of Massachusetts. Wilson Capital provides asset management and related services for clients nationally. Wilson Capital will file and maintain all applicable licenses as required by the state securities boards and/or the Securities and Exchange Commission (“SEC”), as applicable. Wilson Capital renders individualized responses to persons in a particular state only after complying with the state’s regulatory requirements, or pursuant to an applicable state exemption or exclusion.

Click below to download a PDF of the complete Investment Letter:

Wilson-Capital-1Q-2015-Investment-Letter1.pdf (629 downloads )

2014 4Q Investment Letter

As an investment advisor, we feel investors should have an information outlet for the financial markets that is thorough, but does not require a prerequisite degree in economics. Thus we have included a glossary of terms at the end of this commentary. Each term with an asterisk has a corresponding definition in the glossary. We hope this makes our commentary informative and educational for all levels of investors.

2014 was a mixed bag for returns across many different asset classes. The U.S. large-cap stocks, as judged by the S&P 500, had another stellar year making it the 6th year in a row of positive returns. Interest rates swiftly reversed their upward trend as the page turned to 2014, which contributed to a better than anticipated year for bonds. Commodities continued their losing streak to a fourth year as the massive decline in oil prices played a significant role in weak returns.

Asset Class† 2014 Annual Return
U.S. Large Cap Stocks 13.7%
U.S. Small Cap Stocks 4.9%
International Stocks -3.9%
U.S. Bonds 6.0%
Commodities -17.0%

Quarter in Review

As we noted in our 3Q letter, the 4th quarter started with increased volatility as the markets were spooked by the possibility of an Ebola outbreak and heightened instability in the Middle East. As both issues subsided in late October, the stock market rebounded to new record highs as the year came to a close.

The undercurrent of the market during the 4th quarter was the aforementioned decline in the price of oil. The decline was big enough to push gasoline prices to their lowest levels since 2009, essentially giving the American public a tax cut just before the holiday season. While worries of persistently low wage growth* still plagues workers, the lower gas prices could have a stimulating effect on the economy as it adds more money to consumers’ pockets.

Lower gasoline prices are projected to play a role in holding down the already low inflation rates (1.3% as of November) in the U.S. and abroad. Since the Federal Reserve has signaled that both low unemployment (5-6%)and higher inflation (2%) need to be present in order to raise interest rates, bond yields dropped to their lowest levels in nearly 2 years as 2014 came to a close.

Outlook

The current bull market is headed into its 6th year, leaving many talking heads to question whether the market has grown too long in the tooth — a term thrown around in these times is whether the market is “overvalued”. “Valuedness” is normally tied to the earnings of the companies that make up the market. As company earnings rise and fall so do their stock price. However, earnings and prices do not always rise in lock step, in fact they rarely do. In the current and two most recent bull markets (late 90s and mid 00s) earnings have outpaced prices early, but price eventually caught up to the trends set by earnings.

Late 90’s Bull Market and Dot Com Bubble Collapse
(Click to Expand Image)

2014 4Q Late 90s NEW
Mid 00’s Bull Market and Financial Crisis of 2008
(Click to Expand Image)

2014 4Q 2000s NEW
The point where the price outpaces earnings has spelled trouble for the past two bull markets. Today we find the markets approaching that same precarious point where the growth of price and earnings cross.

Current Bull Market
(Click to Expand Image)

2014 4Q Current Bull NEW
This scenario doesn’t necessarily mean a bear market is in the works, but does raise concern that the consecutive years of positive returns might be hitting a hiccup.

Glossary

*Wage Growth – Wage data is compiled by the Bureau of Labor Statistics and disseminated in its monthly employment situation usually on the first Friday of each month

† Indices used to represent asset classes:
U.S. Large Cap Stocks – S&P 500
U.S. Small Cap Stocks – Russell 2000
International Stocks – MSCI ACWI ex-U.S.
U.S. Bonds – Barclays Aggregate
Commodities – Bloomberg Commodity

IMPORTANT INFORMATION

The information presented here is not specific to any individual’s personal circumstances.

To the extent that this material concerns tax matters, it is not intended or written to be used, and cannot be used, by a taxpayer for the purpose of avoiding penalties that may be imposed by law. Each taxpayer should seek independent advice from a tax professional based on his or her individual circumstances.

These materials are provided for general information and educational purposes and represents Wilson Capital’s views based upon publicly available information from sources believed to be reliable—we cannot assure the accuracy or completeness of these materials. The information in these materials may change at any time and without notice.

Wilson Capital is a Registered Investment Advisor (“RIA”), registered in the state of Massachusetts. Wilson Capital provides asset management and related services for clients nationally. Wilson Capital will file and maintain all applicable licenses as required by the state securities boards and/or the Securities and Exchange Commission (“SEC”), as applicable. Wilson Capital renders individualized responses to persons in a particular state only after complying with the state’s regulatory requirements, or pursuant to an applicable state exemption or exclusion.

Click below to download a printable version of our 2014 4Q Investment Letter:
Wilson-Capital-4Q-2014-Investment-Letter.pdf (678 downloads )


2014 3Q Investment Letter

As an investment advisor, we feel investors should have an information outlet for the financial markets that is thorough, but does not require a prerequisite degree in economics. Thus we have included a glossary of terms at the end of this commentary. Each term with an asterisk has a corresponding definition in the glossary. We hope this makes our commentary informative and educational for all levels of investors.

Quarter in Review

The past quarter went for the markets much like it does for many–a quiet and enjoyable end of summer followed by busy and nerve-wracking September.  July and August showed mostly steady gains and low trading volume, but once the calendar turned for September the trend broke. A poor employment reading from August kicked off the first week and was followed by increasing unrest in the Middle East and ended with the first confirmed case of the Ebola virus in the U.S.

Overall both the U.S. equity and bond markets showed slight gains for the quarter with 1.1% for the S&P 500 and 0.2% for the Barclays Aggregate Index. In an almost entire reversal from the second quarter, valuations* edged lower while volatility made a comeback. Stock valuation based on the S&P 500 p/e ratio* fell to 18.2, down from 19.0 at the end of September due to strong company earnings.

Outlook

Typically, we reserve any comments on the current quarter for the following Investment Letter, but the beginning of the 4th quarter has been far from normal. The volatility that resurfaced at the end of September continued into October where 1% moves both up and down have become a near daily occurrence during the first two weeks of trading.

The U.S. economy continues to show signs of improvement with positive long-term trends in unemployment and consumer confidence*, but lately those trends have been overshadowed by current news about rising tensions in the Middle East and the potential spread of Ebola. These events, combined with weaker economic growth statistics from abroad, lower oil prices, and a strong dollar, have all clouded an otherwise spectacular long-term market trend.

Two of the most interesting trends in the market today are a strengthening U.S. dollar and lower oil prices. Read on to learn how they could shape the financial landscape in the next few months.

Strengthening U.S. Dollar

A strong currency sounds desirable on the surface. As the U.S. dollar strengthens, Americans can purchase foreign goods at a lower price. This portrays a sense of economic superiority and makes for a cheaper vacation when travelling abroad. However, the danger in a strong dollar is less about how Americans view purchasing international goods, but rather how foreign nations react to paying higher American prices. Since American goods become comparatively more expensive in a strong dollar scenario, it could lead foreign countries and companies to reduce purchases of American goods. The resulting lower demand for U.S. goods is potentially a cause for concern if it has a ripple effect across U.S. employment and economic growth. A more likely result is a reduction in the stability gap between U.S. and foreign countries, which in the long run should be more valuable to investors around the world.

Lower Oil Prices

Until recently, worldwide population growth and an increased global reliance on oil from OPEC led to steadily higher oil prices since the 1970’s. As consumption increased, OPEC was able to maintain supply levels that set the market price. These economics changed when hydraulic fracturing (fracking) allowed for previously un-drillable oil to be pumped out of the ground in the U.S., lessening America’s dependence on OPEC oil. Coupled with the above-mentioned weaker international growth prospects, there is a larger supply of oil and less demand. The resulting lower prices have positive effect such as lower gasoline and heating costs, giving U.S. consumers the equivalent of a tax break. There are limits however, to how low the price of oil can go. Drilling for oil is a capital-intensive process that becomes unprofitable at certain price thresholds depending upon how and where the oil is drilled. Hitting the point where a majority of suppliers decide to halt production is not a desirable result, as it no longer benefits consumers with lower prices. The hope is that demand will increase as the price of oil falls, which like a strong dollar, could spark global economic activity.

Glossary

Valuations and p/e ratio – Standardized measures that help determine how much a company is worth. The p/e ratio is a standardized measure of how much investors are paying for each dollar of earnings. An 18x p/e ratio means investors are paying 18 times each dollar of earnings.

Consumer Confidence – Economic indicators that measure the degree of optimism consumers feel about the economy and their personal financial situation. Higher consumer confidence is considered a bullish indicator of the economy.

OPEC – The Organization of the Petroleum Exporting Countries. A group of major oil producing nations that collude to set production levels. OPEC produces approximately 40% of the world’s oil supply.

IMPORTANT INFORMATION

The information presented here is not specific to any individual’s personal circumstances.

To the extent that this material concerns tax matters, it is not intended or written to be used, and cannot be used, by a taxpayer for the purpose of avoiding penalties that may be imposed by law. Each taxpayer should seek independent advice from a tax professional based on his or her individual circumstances.

These materials are provided for general information and educational purposes and represents Wilson Capital’s views based upon publicly available information from sources believed to be reliable—we cannot assure the accuracy or completeness of these materials. The information in these materials may change at any time and without notice.

Wilson Capital is a Registered Investment Advisor (“RIA”), registered in the state of Massachusetts. Wilson Capital provides asset management and related services for clients nationally. Wilson Capital will file and maintain all applicable licenses as required by the state securities boards and/or the Securities and Exchange Commission (“SEC”), as applicable. Wilson Capital renders individualized responses to persons in a particular state only after complying with the state’s regulatory requirements, or pursuant to an applicable state exemption or exclusion.

Click below to download a printable version of our 2014 3Q Investment Letter:

Wilson-Capital-3Q14-Investment-Letter.pdf (637 downloads )

Are Target Date Funds the Best 401(k) Option?

In recent years an increasing number of employers are adding so-called “target date” funds to their 401(k) menus. In many cases, they are the default option for employees when they start contributing to their accounts. These funds typically include a year in their name and are mutual funds that shift investment allocations over time in anticipation for a “target” retirement date.

Target date funds are designed around generally accepted investment theories where higher risk/ higher potential return investments like stocks should have a larger allocation in the early years of a career. As retirement nears, that allocation should shift towards investments in bonds and cash, which tend to be less volatile. In general, these funds make it much easier for employees to “set it and forget it”, but not all target date funds are created equal and some may not fit into a successful retirement plan.

Here are a couple of ways these funds can fall short.

One target date does not fit all

Depending upon each investor’s total financial picture, the target date may not match up with their overall risk profile. In some cases, the 401(k) may make up a small portion of an investor’s total net worth. In that case they may wish to be more aggressive even as retirement approaches since 401(k) money may not be used for many years. On the other hand, some investors may be relying on their 401(k) for the bulk of their retirement funds and a target date fund will not provide enough stability to stomach market swings when retirement is only months away.

There’s no such thing as a free mutual fund

As with most financial products, there is a price to pay for this packaged “solution”.

The fees in target date funds vary widely, from reasonable to exorbitant. Many 401(k) plans offer low expense index mutual fund options that may be much less expensive than those paid in a target date fund. By combining these index funds, employees may be able to create their own custom target date fund at a fraction of the price.

In a recent example with a client, Wilson Capital was able to create a portfolio of mutual funds that replicated the investment allocation of his target date fund. The result was a portfolio with a total fee of 0.25% versus 0.75% for a JP Morgan target date fund, working out to a difference of $5 per $1,000 invested in his 401(k).

If fees are the primary concern about using target date funds, the offerings from Vanguard and TIAA-CREF are more reasonably priced and worthy of an allocation if they are available in a 401(k) plan.

Despite some shortfalls, target date funds protect from a wayward 401(k) allocation. For those people without the desire or time to tinker with their 401(k), target date funds might still be the best option.


IMPORTANT INFORMATION

The information presented here is not specific to any individual’s personal circumstances.

To the extent that this material concerns tax matters, it is not intended or written to be used, and cannot be used, by a taxpayer for the purpose of avoiding penalties that may be imposed by law. Each taxpayer should seek independent advice from a tax professional based on his or her individual circumstances.

These materials are provided for general information and educational purposes and represents Wilson Capital’s views based upon publicly available information from sources believed to be reliable—we cannot assure the accuracy or completeness of these materials. The information in these materials may change at any time and without notice.

Wilson Capital is a Registered Investment Advisor (“RIA”), registered in the state of Massachusetts. Wilson Capital provides asset management and related services for clients nationally. Wilson Capital will file and maintain all applicable licenses as required by the state securities boards and/or the Securities and Exchange Commission (“SEC”), as applicable. Wilson Capital renders individualized responses to persons in a particular state only after complying with the state’s regulatory requirements, or pursuant to an applicable state exemption or exclusion.


Rent vs Buy: A Debate and Resources

Through multiple generations and market gyrations, home ownership is a goal of many young professionals. The question I hear asked the most from the current group of aspiring buyers is “Can I afford it?” Affordability is often the hurdle to be cleared for ownership, but that doesn’t necessarily mean that affordability is the only factor. Home ownership has it’s benefits including tax deductions and gaining equity in your living space. Renting typically offers lower monthly payments and flexibility, the later of which is often overlooked by would-be buyers.

If a prospective buyer isn’t sure they could live in their house for several years they are rolling the dice on whether their investment will break even. This is due mostly to the one-time costs for buying and selling houses including lawyers’ fees, broker fees and title insurance, which can eat into any equity built over short periods of time. It is also due higher expectations of price appreciation. In “The New Math of Renting vs. Buying”, in the Wall Street Journal on May 2nd 2014, the author make the claim that in the last 30 years ending 2013, national housing prices rose at a 3.6% annual rate, while the U.S. stock market rose at 11.1% annual rate. This isn’t exactly an apples to apples comparison since your stock account can’t double as shelter, but does provide some perspective on how home values hold up as an investment.

A great tool to use when deciding to buy or rent is the Buy vs. Rent Calculator on the New York Times website. It does a great job showing the breakeven point of buying and renting (hint, hard to do it in less than 5 years!).


2014 2Q Investment Letter

As an investment advisor, we feel investors should have an information outlet for the financial markets that is thorough, but does not require a prerequisite degree in economics. Thus we have included a glossary of terms at the end of this commentary. Each term with an asterisk has a corresponding definition in the glossary. We hope this makes our commentary informative and educational for all levels of investors.

Quarter in Review

With the turbulent first quarter safely in the rear-view mirror, stocks increased steadily, continuing the now 5-year bull market. The S&P 500 returned 5.2% and interest rates edged slightly lower, giving bonds, as measured by the Barclay’s Aggregate index, a 2.0% return for the quarter (interest rates move inversely with bond performance).

Underscoring the steadiness of stock returns, in May, the VIX, a measure of stock market volatility, sunk to its lowest levels in over 7 years. While steady, the increases are finally catching up with underlying valuations as the price-to-earnings ratio* of the S&P 500 rose to 18.8, which is in line with the 50-year average, but the highest level since late 2010.

Given the recent returns and low volatility it is almost unbelievable that this recent quarter of prosperity comes amid increasing global tension, lower company earnings and continued talk of higher interest rates. Even more confounding is the fact that the latest reading of U.S. economic growth, as judged by Gross Domestic Product (GDP)*, decreased 2.9% from 2013. Much of that decline can be attributed to the bad weather that plagued the country, but bull markets can only sustain for so long on the anticipation of better times ahead.

Outlook

With growing concern over growth of the U.S. economy, there is increased focus on the consumer and the impact inflation and stagnant wage growth plays in the broader economy.

Inflationary Pressure

As we noted in our 4th quarter 2013 Investment Letter, the Federal Reserve has a dual mandate to achieve maximum employment and price stability. The current low interest environment is intended to increase employment, but can also mean higher inflation, or rising prices on consumer goods. The Federal Reserve’s job is to strike a balance where the largest amount of people have money to spend while also making sure that the demand for goods and services isn’t accelerating at a pace that makes items too expensive.

The basket of goods the Fed uses to judge inflation includes almost anything Americans can buy, from cars to coffee and everything in between. However, the most preferable “core” inflation is a measure that excludes food and energy costs since they are more prone to short-term price volatility. While volatile, these prices have a real impact on the wallets of the American consumer and lately the impact has been significant. The May Consumer Price Index* showed that all items except food and energy rose at a modest 2.0% since the prior year, with food (+2.5%) and energy (+3.3%) both rising higher. Digging deeper, staples like eggs (+10.1%) and milk (+7.3%) rose higher than the average. This, in conjunction with higher gasoline prices (+2.3%), can make a material impact since they are items without substitutes. This stands in contrast to bigger ticket items like washers and dryers (-7.5%) and televisions (-14%) that have fallen dramatically, but are both discretionary and largely one-time purchases. While the headline number might suggest that inflation is tame, it could be hard convincing an American consumer who feels the heat with everyday purchases.

Stagnant Wage Growth

The basic idea is that with lower interest rates, companies are likely to expand their businesses which in turn leads to increased hiring and wages. This leads to a larger base of people with higher incomes that will spend their money on goods and services.

While companies have taken advantage of the low interest rates by taking on record high levels of debt, they have largely chosen to use this debt for “financial engineering”. This is a strategy where companies will use the cash raised through low-interest debt to buy-back shares of their own stock or issue dividends. Such policies are easy ways to increase their stock price and reward investors, but do little to jump start growth through labor force expansion.

With the U.S. economy still recovering from the financial crisis of 2008, a return to normalized inflation and wage growth may be the finale to full recovery, but it is still troubling given the strengths elsewhere in the economy.

Glossary

Price-to-earnings ratio – a standardized measure of how much investors are paying for each dollar of earnings. An 18x p/e ratio means investors are paying 18 times each dollar of earnings.

Gross Domestic Product – The total value of the goods produced and services provided in a year. Increases in GDP mean that a country’s total economy is growing, Mature economies, such as the U.S., tend to grow slower that those of emerging economies, such as China.

Consumer Price Index – An estimate of price changes of a large basket of goods consumed in the U.S.

IMPORTANT INFORMATION

The information presented here is not specific to any individual’s personal circumstances.

To the extent that this material concerns tax matters, it is not intended or written to be used, and cannot be used, by a taxpayer for the purpose of avoiding penalties that may be imposed by law. Each taxpayer should seek independent advice from a tax professional based on his or her individual circumstances.

These materials are provided for general information and educational purposes and represents Wilson Capital’s views based upon publicly available information from sources believed to be reliable—we cannot assure the accuracy or completeness of these materials. The information in these materials may change at any time and without notice.

Wilson Capital is a Registered Investment Advisor (“RIA”), registered in the state of Massachusetts. Wilson Capital provides asset management and related services for clients nationally. Wilson Capital will file and maintain all applicable licenses as required by the state securities boards and/or the Securities and Exchange Commission (“SEC”), as applicable. Wilson Capital renders individualized responses to persons in a particular state only after complying with the state’s regulatory requirements, or pursuant to an applicable state exemption or exclusion.

Click below to download a printable version of our 2014 2Q Investment Letter:
Wilson-Capital-2Q14-Investment-Letter.pdf (550 downloads )


2014 1Q Investment Letter

As an investment advisor, we feel investors should have an information outlet for the financial markets that is thorough, but does not require a prerequisite degree in economics. Thus we have included a glossary of terms at the end of this commentary.  Each term with an asterisk has a corresponding definition in the glossary. We hope this makes our commentary informative and educational for all levels of investors.

Quarter in Review

The beginning of a new year kicks off with a rough start for many people and in 2014 the stock market followed suit. While champagne is typically the culprit for revelers, an exuberant year of returns in 2013 laid the groundwork for stocks to reverse course in January.

After turning in the best year of returns since 1997, the S&P 500 returned -3.5% in January, the worst monthly performance since May of 2012. While significant, the downturn was short-lived, as stocks reversed course during February and March to turn in a positive return (+1.8%) for the S&P 500 for the quarter. The Federal Reserve* (Fed) has continued it’s “tapering”* program, furthering its efforts to wean the U.S. off record low interest rates. Despite this program and increased hints to raising interest rates in 2014-2015, the yield on U.S. treasury bonds defied logic by declining during the quarter. This move was justified by political unrest in Ukraine and weakening growth prospects in emerging markets. As a result, “safe haven” investments such as bonds†  (+1.8%) and gold † (+7.2%), both showed gains for the quarter.

Turning to economic growth in the U.S., corporate earnings for the 4th quarter of 2013 showed continued strength, with approximately 70% of companies in the S&P 500 exceeding analyst estimates.  Revenue growth still lags earnings growth indicating lower “earnings-quality” based on cost-cutting and share buy-backs* rather than increased sales growth.

Outlook 

With the stock market posting record high gains nearly every week, the talk of whether the U.S. stock market is approaching overvalued levels or even a bubble has also gained momentum.

Despite the pullback in the stock market in January, the rebound through March brought U.S. markets back to reaching new all-time highs. This performance had led many market observers to question whether the stock market is approaching bubble territory. While we are not astrologers, we believe that the stock market has more room to run based primarily on these two reasons:

1.      Stocks aren’t overvalued relative to history

The price-to-earnings ratio* is among the most popular metrics used to determine market value.  It has been well noted that over the past 5 years the stock market, as judged by the S&P 500, has achieved annualized returns of 21%, far exceeding the long-term average of approximately 10%. What is less noted is that during that same time period, the underlying earnings of the index has kept pace with the performance of the stocks, with operating earnings for the S&P 500 rising by 20% for that same period. The tandem rising of both prices and earnings has left the market price-to-earnings ratio at 17.5, which is still below the average of the last 50 years of 18.9 (source: Standard & Poors). To be sure, there is no mechanism that requires the market to become overvalued before it drops, but current valuations do not beg for a correction.

2.     Stocks are still the best house on the block

Compared to other investment options, the stock market still looks attractive. In the simplest terms, tradeable investments can be broken down into three categories: cash (savings or money market accounts), bonds and stocks.  Interest rates that affect both savings accounts and bonds are still near all-time lows. While both cash and bonds have historically been much less volatile investments compared to stocks, at current interest rates, investors are sacrificing a significant amount of yield for safety.

Trying to gauge the direction of the stock market makes us think about the small print on most financial products, which states, “past performance is no guarantee of future results”. Such disclosure is important for all investors to heed, however, it should also be recognized that past performance does not require a reversal of such performance in the future.

Glossary

Federal Reserve – The United States’ central bank, which is responsible for regulating the banking industry and controlling the money supply through monetary policy.

Tapering – Reduction of the bond purchases by the Federal Reserve with the intention of raising interest rates.

Share Buy-backs – Companies use cash from their earnings to purchase shares of the company. This reduces the number of shares held by the public and spreads the earnings of the company across fewer shares.

Price-to-earnings ratio – a standardized measure of how much investors are paying for each dollar of earnings. An 18x p/e ratio means investors are paying 18 times each dollar of earnings.

† Indices used to represent asset classes:

Bonds – Barclays U.S. Aggregate Bond
Gold – London Fix Gold PM

IMPORTANT INFORMATION

The information presented here is not specific to any individual’s personal circumstances.

To the extent that this material concerns tax matters, it is not intended or written to be used, and cannot be used, by a taxpayer for the purpose of avoiding penalties that may be imposed by law. Each taxpayer should seek independent advice from a tax professional based on his or her individual circumstances.

These materials are provided for general information and educational purposes and represents Wilson Capital’s views based upon publicly available information from sources believed to be reliable—we cannot assure the accuracy or completeness of these materials. The information in these materials may change at any time and without notice.

Wilson Capital is a Registered Investment Advisor (“RIA”), registered in the state of Massachusetts. Wilson Capital provides asset management and related services for clients nationally. Wilson Capital will file and maintain all applicable licenses as required by the state securities boards and/or the Securities and Exchange Commission (“SEC”), as applicable. Wilson Capital renders individualized responses to persons in a particular state only after complying with the state’s regulatory requirements, or pursuant to an applicable state exemption or exclusion.

Click below to download a printable version of our 2014 1Q Investment Letter:
Wilson-Capital-1Q14-Investment-Letter.pdf (692 downloads )