3Q20 Investment Letter

We feel investors should have an information outlet for the financial markets that is thorough, but does not require a prerequisite degree in economics. We hope this makes our commentary informative and educational for all levels of investors. 

Quarter in Review

Asset Class†3rd Quarter 2020 ReturnPast 12 Months
U.S. Small Cap Stocks4.9%0.4%
U.S. Large Cap Stocks8.9%15.1%
International Stocks6.3%3.0%
Commodities9.1%-8.2%
U.S. Bonds0.6%7.0%

The 3rd quarter of 2020 was yet another quarter where the final reading of the financial markets does not tell the whole story. The S&P 500 stock index regained all the losses from earlier in 2020, peaking in early September, before retreating four weeks in a row to a still-impressive 8.9% return for the quarter.

The S&P 500, however, reflects only large U.S.-based companies; a segment of the stock market that has been more resilient in 2020. Small-company and non-U.S. stocks, which fell further in the Spring, have yet to regain the losses, remaining in negative territory for the year-to-date. A bright spot is tech-heavy growth stocks have soared in 2020, especially compared to older-economy value stocks. The large-company Russell 1000 Growth index has outperformed its Value counterpart by over 35% in 2020 through the 3rd quarter, widening the divide between those two camps over the past decade to historic proportions.

On the other hand, there has been more uniformity to the bond markets in 2020, with most areas seeing continued gains. The Bloomberg Barclay’s Aggregate index, the standard for U.S. bond measures, turned in a nearly 1% return for the quarter, the ninth consecutive quarter of positive returns. Adding to this streak will be challenging in the coming quarters since bond prices have an inverse relationship to interest rates, where bond prices increase as interest rates decline.

For the past decade, interest rates declined across the globe, leading to this nearly uninterrupted run of bond price increases. With interest rates for 10-Year U.S. Treasury notes under 1%, there is little room for additional gain, assuming interest rates cannot fall below 0%. That assumption, however, may be tested in the coming quarters as many other developed countries have long-term interest rates well into negative territory. In such a scenario, an investor pays a bank to hold their money. This head-scratching concept is due to negative inflation rates (as are occurring in most European countries) where prices for goods and services are declining. In essence, negative inflation incentivizes consumers to delay purchases to pay less in the future. With no eagerness to make purchases, banks can essentially charge a safe-keeping fee. A piggy-bank may prove to be the better approach.

Election Preview

With less than one week to go until election day, most polls are indicating a Joe Biden win and Democratic control of both houses in Congress. However, as we now know from the 2016 election, polls can be very wrong.

If the predictions are correct in 2020, this will be the 5th time in the last 40 years when one party controls all three elected arms of the federal government. Two times apiece for Democrats and Republicans. How has this played out for the stock market? The table below shows the annualized return for the S&P 500 for each period of one-party control:

Republican Controlled
2002-2006                12.9%
2016-2018                15.7%
Average                   14.3%
Democrat Controlled
1992-1994                 8.4%
2008-2010                 11.5%
Average                    9.9%

Average of Entire Period (Nov 1992-Nov 2018) 9.7%

While drawing a meaningful conclusion from four data points is somewhat frivolous since voter whims do not dictate economic cycles, stock market returns with one-party control are similar to the average for the entire 40 year period.

The volatility that returned to the stock market this week indicates that investors see uncertainty around the path of COVID-19 and perhaps how surging cases could cloud election forecasts. Due to these circumstances, Wilson Capital will distribute a post-election newsletter to outline the election results and what they mean for the U.S. economy heading into 2021.

IMPORTANT INFORMATION

The information presented here is not specific to any individual’s personal circumstances.

To the extent that this material concerns tax matters, it is not intended or written to be used, and cannot be used, by a taxpayer for the purpose of avoiding penalties that may be imposed by law. Each taxpayer should seek independent advice from a tax professional based on his or her individual circumstances.

These materials are provided for general information and educational purposes and represents Wilson Capital’s views based upon publicly available information from sources believed to be reliable—we cannot assure the accuracy or completeness of these materials. The information in these materials may change at any time and without notice.

Wilson Capital is a Registered Investment Advisor (“RIA”), registered in the state of Massachusetts. Wilson Capital provides asset management and related services for clients nationally. Wilson Capital will file and maintain all applicable licenses as required by the state securities boards and/or the Securities and Exchange Commission (“SEC”), as applicable. Wilson Capital renders individualized responses to persons in a particular state only after complying with the state’s regulatory requirements, or pursuant to an applicable state exemption or exclusion.


2Q20 Investment Letter

We feel investors should have an information outlet for the financial markets that is thorough, but does not require a prerequisite degree in economics. We hope this makes our commentary informative and educational for all levels of investors. We have also included a glossary at the end of this commentary that defines terms marked with an asterisk (*).

Quarter in Review

Asset Class†

2nd Quarter 2020 Return

Past 12 Months

U.S. Small Cap Stocks 25.4% -6.6%
U.S. Large Cap Stocks 20.5% 7.5%
International Stocks 16.1% -4.8%
Commodities 5.1% -17.4%
U.S. Bonds 2.9% 8.7%

Depending on the viewpoint, the past results of the market can be framed in many ways. Good news first, April was the best month for the S&P 500 since January 1987 and the 2nd quarter was the best quarter for that index since 1998. On the flip side, the first half of 2020 was the worst first half-year for the S&P 500 in a decade, a reminder of the carnage faced in the first quarter. Conversely, bond market returns are on a meteoric pace. With bond yields continuing on a lower trajectory, the prices of bonds have rocketed higher–extending a sharp rise in bond prices that started in late 2018. While it has been a great time to be securing debt (think mortgage refinances), it perhaps is not the best time to be a bond investor. At some point, bond prices will succumb to a fall. 

With amusement parks closed nationwide, Americans had to get their excitement elsewhere during the 2nd quarter. The stock market seems to have filled the entertainment void for many, with record numbers of new brokerage accounts opened and wild daily swings during the quarter.  Continuing a trend that started in the first quarter, new accounts at the major online brokers rose significantly, with Charles Schwab reporting over 3 times the amount of new account openings in the 2nd quarter of 2020 versus the same period in 2019. With increased volatility, daily changes to stock market averages provided an emotional roller coaster not unlike Six Flag’s most daring offering.

A New Normal or Something Different?

COVID-19 has upended all market forecasts made at the start of the year. Below is a list of some of the most important factors currently in play and how these factors could affect the future path of the economy.

Variable

What’s Happened

How it Affects the Future

Unemployment Rate Going into the pandemic, the unemployment rate was at record low levels. In April, it shot up to 14.7%, the highest in decades.  As businesses re-open, the number of unemployed should decrease, but the rate of the rebound is in question. This is especially important as unemployment benefits expire for most Americans in the next 3-6 months.  
Inflation Inflation was hovering around 2% for several years, but has been muted in the past 2 months to near 0% A low inflation rate will enable the Fed to keep interest rates low without the worry of skyrocketing prices. 
Interest Rates The benchmark 10-Year U.S. Treasury Note has hit the lowest level in history, falling to under 1%. Continually lower interest rates will encourage spending at both the personal and corporate level.
Vaccine Timeline Several COVID vaccines are in the pipeline seeking approval. Over 100 vaccines are being tested and 5-10 are currently in phase 2 or awaiting FDA approval. The typical timeline for a vaccine from development to distribution is around a decade. The speed at which a vaccine can be implemented is crucial to medium-to-long term economic forecasts.
Presidential Election National polling indicated a tight race in early 2020, but since the pandemic, Biden has taken a near 10% lead.  Trump had continually been viewed as the economically friendly option, but markets seem to be getting more comfortable with a Biden victory despite pledges for higher tax rates. 
Consumer Spending Consumer spending fell off of a cliff in April, with the biggest one-month percentage decline on record. It rebounded in May, but numbers are still well below pre-COVID rates.  With many businesses closed, especially those in services and leisure, it is unclear how spending can fully rebound without a vaccine. 
Fiscal Stimulus  Several rounds of swift fiscal stimulus packages to both individuals and businesses saved the economy from catastrophe during the second quarter. Talks continue about the need for more stimulus efforts in the coming months.  In the near-term, fiscal stimulus is the most effective weapon in the government’s arsenal to fill the void of income and spending. Longer-term effects of increased deficit spending are troublesome. 

These factors, among others, will play a role in shaping an economic path forward. With data changing daily, it is a challenge to forecast the near future. However, the recent months have given more clarity to the best and worst cases that could occur.  

Worst-Case Scenario:

The worst-case scenario centers around a delayed vaccine timeline. Should several of the leading vaccine candidates be deemed ineffective in the coming months, the clouds will move back over the economy. This would be compounded if new cases and deaths rise significantly in the fall months resulting in the majority of the U.S. once again being restricted to stay-at-home orders. Should a vaccine be viewed as further away than currently expected, factors such as unemployment, consumer spending, and fiscal stimulus demand will stress the capabilities of a functioning economy. Continuing high unemployment will require the government to issue trillions more in financial stimulus and also limit advances in consumer spending. Another negative for the economy would be a poorly functioning election where issues with mail-in ballots or foreign interference create confusion over the results.

Best-Case Scenario:

A truly bullish scenario for near-term economic success would need to involve an effective vaccine by early 2021. That scenario would enable most activities to resume in full by the second quarter of 2021 and would make COVID more of a short-term issue. Short of an effective vaccine in less than a year, successful business and school re-openings without significant setbacks, especially as we enter the colder fall season would be welcomed news. If the number of new cases decline in the current hot spots and the feared fall resurgence fizzles, consumer discretionary spending would immediately improve the outlook for employment and corporate results.

The actual path forward will likely borrow from both cases, with a large amount of the future outcome dependent on the vaccine timeline. It is also possible that the path of the stock market and economy will diverge from the path of the virus, as we witnessed at the end of the second quarter. Regional differences in virus preparedness/reaction along with widening divisions in the social fabric of our country further cloud the picture of what is ahead.


† Indices used to represent asset classes:
U.S. Large Cap Stocks – S&P 500
U.S. Small Cap Stocks – Russell 2000
International Stocks – MSCI ACWI ex-U.S.
U.S. Bonds – Bloomberg Barclays Aggregate
Commodities – Bloomberg Commodity

IMPORTANT INFORMATION

The information presented here is not specific to any individual’s personal circumstances.

To the extent that this material concerns tax matters, it is not intended or written to be used, and cannot be used, by a taxpayer for the purpose of avoiding penalties that may be imposed by law. Each taxpayer should seek independent advice from a tax professional based on his or her individual circumstances.

These materials are provided for general information and educational purposes and represents Wilson Capital’s views based upon publicly available information from sources believed to be reliable—we cannot assure the accuracy or completeness of these materials. The information in these materials may change at any time and without notice.

Wilson Capital is a Registered Investment Advisor (“RIA”), registered in the state of Massachusetts. Wilson Capital provides asset management and related services for clients nationally. Wilson Capital will file and maintain all applicable licenses as required by the state securities boards and/or the Securities and Exchange Commission (“SEC”), as applicable. Wilson Capital renders individualized responses to persons in a particular state only after complying with the state’s regulatory requirements, or pursuant to an applicable state exemption or exclusion.


1Q20 Investment Letter

We feel investors should have an information outlet for the financial markets that is thorough, but does not require a prerequisite degree in economics. We hope this makes our commentary informative and educational for all levels of investors. 

Quarter in Review

Asset Class†1st Quarter 2020 ReturnPast 12 Months
U.S. Small Cap Stocks-30.6%-24.0%
U.S. Large Cap Stocks-19.6%-7.0%
International Stocks-23.4%-15.6%
Commodities-23.3%-22.3%
Bonds3.2%8.9%

The trend of positive stock market results ended abruptly this quarter as COVID-19 became a global pandemic. March 2020 was the worst single month for most stock market indexes since the height of the financial crisis in October 2008. While the declines were deep, the speed at which the markets dropped was unprecedented. The table below shows how much quicker the S&P 500 moved downward in this crisis versus the 2008 crisis.

Time in Trading Days from High to Decline Level

Market DeclineDays in 2020 to Reach Level of Decline
(High 2/19/2020)
Days in 2008 to Reach Level of Decline
(High 10/9/2007)
-10%633
-20%16188
-30%22250

The severe downward declines slowed in the month of April, but daily stock market moves of 1% or more have become the rule rather than the exception.

Oil has also grabbed headlines throughout the coronavirus crisis. First, in early March, Saudi Arabia, acting as lead member of OPEC*, attempted to enter an agreement with Russia to restrict the supply of oil as lower demand due to COVID-19 threatened to upend oil markets. Talks failed and Russia backed out of the agreement, kicking off a race-to-the-bottom price war. This, in itself, was some of the biggest news in the commodity world in the past quarter century.  However, this was nothing compared to what occurred on April 20th when oil prices dropped to negative $37 per barrel. With demand dropping even more precipitously than expected, oil storage became a problem and tankers full of oil had no port that could accept their oil. In the rarest of all rare events, this meant that a seller would actually pay a buyer to take the oil off their hands, but even that was hard for sellers to accomplish since it’s not exactly easy to store a tanker load of oil. It’s times like this that you wonder why you didn’t install a 100-million-gallon oil tank in your yard.

Lessons learned: Investing during a crisis

During turbulent times like the period we find ourselves in now, it can be tempting for investors to make changes to their investments in reaction to the events unfolding. It is cliché for advisors to remind clients to stay the course, so instead of talking the talk, the following example plays some Monday morning quarterback–showing how an unchanged static portfolio performed versus 4 other portfolios that changed allocation during the 1st quarter through April 24th

This following example is merely for illustration and does not represent actual investments. The returns of the S&P 500 index are used for stocks and the Bloomberg Barclays Aggregate Bond index for bonds. The static portfolio is a 60% stock and 40% bond allocation at the start of the 1st quarter. 

The Crystal Ball Gazer

This investor was so wise that they made the decision to sell all investments at the portfolio high on February 19th. Such a move would have returned nearly 9% more than the static portfolio, but let’s put this stroke of luck in some context; on February 19th there were 12 total confirmed cases of COVID-19 in the United States and zero deaths.

The Sad Sack

This investor made the opposite choice as the Crystal Ball Gazer and decided, to heck with it, I’m going to go all stocks on February 19th. This would have been a stroke of bad luck, and would have been a very wild ride, but the end result would not have been disastrous, returning about 8% less than the static portfolio.

The Opportunist

This investor decided to move all their money into stocks starting on March 24th, the day after the lowest close of the S&P 500 during the quarter. This move had the best result of all the scenarios, outperforming the static portfolio by 9%. While not implausible that an investor would have picked a market bottom, the stock market bottom occurred far earlier than any economic rebound. In fact, as of March 23rd, only 9 states had enacted stay-at-home provisions. 

The Scaredy Cat

This investor decided that enough was enough at just the wrong time, going to 100% cash on March 24th. This portfolio would have had the worst performance of all the scenarios, returning 13% less than the static portfolio. This result is not surprising as it fits into the behavioral economic framework that investors have strong reactions to volatility. Like the “fight or flight” mechanism, human nature tells us to be protective or overly aggressive in distressed times.

Conclusion

In total, the static portfolio would have returned -5.0% for the time period, while the average return for the other 4 portfolios was -5.6%. In short, if there is equal probability to choose each of the 4 options presented, investors would have, on average, done worse making one of these changes rather than staying the course.

Portfolio ScenarioReturn 1/1/2020 to 4/24/2020
Static-5.0%
The Crystal Ball Gazer+3.8%
The Sad Sack-12.7%
The Scaredy Cat-17.8%
The Opportunist+4.3%

While this very short-term example indicates the dangers of making investment decisions based on emotion, it does not mean that long-term investment strategy should be static. In fact, the periods following a major market reversal can be some of the most valuable for an investor to evaluate their risk tolerance. If you found yourself checking account balances daily, watching financial news more frequently, or even losing sleep over financial worries, this would be a good time to put some thought in your investment allocation.

Glossary

OPEC – The Organization of Petroleum Exporting Countries is a cartel of 14 nations which comprise approximately 44% of oil production and over 80% of proven reserves as of September 2018. The cartel does not include either the largest oil producer, U.S.,  nor 3rd higher oil producer, Russia.

† Indices used to represent asset classes: 
U.S. Large Cap Stocks – S&P 500
U.S. Small Cap Stocks – Russell 2000
International Stocks – MSCI ACWI ex-U.S.
U.S. Bonds – Bloomberg Barclays Aggregate
Commodities – Bloomberg Commodity

IMPORTANT INFORMATION

The information presented here is not specific to any individual’s personal circumstances.

To the extent that this material concerns tax matters, it is not intended or written to be used, and cannot be used, by a taxpayer for the purpose of avoiding penalties that may be imposed by law. Each taxpayer should seek independent advice from a tax professional based on his or her individual circumstances.

These materials are provided for general information and educational purposes and represent Wilson Capital’s views based upon publicly available information from sources believed to be reliable—we cannot assure the accuracy or completeness of these materials. The information in these materials may change at any time and without notice.

Wilson Capital is a Registered Investment Advisor (“RIA”), registered in the state of Massachusetts. Wilson Capital provides asset management and related services for clients nationally. Wilson Capital will file and maintain all applicable licenses as required by the state securities boards and/or the Securities and Exchange Commission (“SEC”), as applicable. Wilson Capital renders individualized responses to persons in a particular state only after complying with the state’s regulatory requirements, or pursuant to an applicable state exemption or exclusion.


4Q19 Investment Letter

We feel investors should have an information outlet for the financial markets that is thorough, but does not require a prerequisite degree in economics. We hope this makes our commentary informative and educational for all levels of investors. 

Quarter in Review

Asset Class†4th Quarter ReturnPast 12 Months
U.S. Small Cap Stocks9.9%25.5%
U.S. Large Cap Stocks9.1%31.5%
International Stocks8.9%21.5%
Commodities4.4%7.7%
U.S. Bonds.2%8.7%

The 4th quarter performance in stock markets around the globe was the icing on the cake for a year where stocks returned over 20%. In addition, bonds also had a great year with broad U.S. bond returns just shy of 9%. The combined return of 40.2% for the S&P 500 stock index and the Barclays Aggregate bond index is the highest since 1997, when the combined return was 43%.

Stock returns were relatively uniform, as all sectors ended the year with at least double-digit positive returns. Information technology led all sectors, while the energy sector lagged at the end of the group of 11 sectors in the S&P 500. Stock market returns were impressive, but perhaps more impressive were the returns from the bond markets. Heading into 2019, interest rates had increased steadily over the prior three years, but a reversal of interest rates caused bond returns to swell to their best year since 2002 (Interest rates move inversely to bond returns). 

For a quarter where the S&P 500 returned over 9%, the 4th quarter of 2019 was rather unremarkable in terms of news events. In early October, the U.S. and China agreed to a preliminary trade deal, which was certainly good news for the markets, but hardly the type of news that typically prompts a market surge. However, that news, along with better-than-expected inflation and employment data, proved to provide enough fuel to power the market higher.

2020 Outlook

A full-year outlook for the financial markets is always a difficult task, but given the historic stock market rise, interest rate fluctuations, and a U.S. Presidential election, 2020 could go in many directions making prognostications especially tricky. This being the case, we’ve put together a short list of factors that drive market movements, assess their current situation, and provide some concerns that may shift the markets away from their current state of historical returns achieved in 2019.

Stock Market Valuation

First off, stock market valuations are not at an alarmingly high level. This may seem hard to believe given the market’s rise, but corporate earnings have risen in near lock-step with stock prices (as was detailed in the 3rd quarter 2019 newsletter). The price/earnings ratio of the S&P 500 is hovering slightly below the average of the last 5 years and while price/book ratios* are slightly higher than their 5-year averages, they also reflect a market dominated by firms that do not require large amounts of capital to operate (i.e. technology). 

Concern: Margins can no longer expand. Margins (meaning the percentage of revenue that is converted to profits) are the main variable that corporate executives can control to maximize shareholder returns. The recent tax law changes, along with a low inflation environment, have allowed companies to increase their bottom lines with relative ease in the past 2 years; positive macro events that can’t be expected to reoccur.

Interest Rates

As mentioned in several quarterly letters in recent years, interest rates have been on a roller coaster ride, but they seem to have leveled out in the last half of 2019. The concern over an inverted yield curve (where longer term bonds yield less than shorter term bonds–see the 2nd quarter 2019 commentary for more) has abated in the last couple months of 2019. The emergence of the inverted curve was one of the biggest concerns for market watchers as that has historically been an indicator of a recession.

Concern: A return to a rising interest rate environment could hamper economic prospects. Lower yields allow corporations and consumers to access cheaper credit, greasing the wheels of spending. This reverberates across the economy, affecting home purchases, corporate expenditures, and share repurchases to name a few. 

Economic Indicators

Employment indicators in the U.S. are at some of the best levels in history with unemployment at the lowest level since 1969 and average hourly earnings at the highest they have been since the 2008 financial crisis. Inflation remains at reasonable levels, allowing for accommodative monetary policy (lower interest rates). Combined, these factors have acted as a tailwind for consumer spending. 

Concern: An increase in inflation, or a reversal in hourly earnings growth, could have effects that reverberate in the markets. Along with ending the spending tailwind, such increases would likely cause the Federal Reserve to reverse their more accommodative, lower-interest rate, policy.

Foreign Markets

Between Brexit in Europe, a decline in Chinese economic growth, and generally worse economic indicators (compared to the U.S.), there aren’t many positive things to point to outside of the U.S. So far, this hasn’t had a material effect on the U.S. economy and is already baked into the current economic situation. 

Concern: A UK-less European Union could be messier than already predicted, causing delay in the new trade policies they will need to create with other nations. This is in addition to the trade war with China, which has hurt both the U.S. and Chinese economies.

U.S. Politics/Election

By now, Americans know that politics in the era of the Trump presidency is anything but predictable. As of late-January, Trump is the odds-on favorite to win the election in November, but he still needs to make it through the impeachment trial and face-off against a Democratic challenger. Given the market performance during his presidency, a Trump victory would likely be positive for the markets in the short-term, but there are 10 months and thousands of Tweets to go before we get those results. 

Concern: The recent intervention with Iran increased the possibility of a much larger foreign conflict in the Middle East and the trade war with China isn’t over yet, leaving the door open for some negative news for the markets. It is also uncertain how markets will react to election primary season, as the field for a Democratic nominee narrows. The nomination of one of the more progressive Democratic candidates would likely have a negative effect on the markets in the short-term, but all bets are off the table as the general election nears and democrats will need to move toward the center to appeal to a larger swath of voters.

Glossary

Book Value – Value of all the assets of a company minus the liabilities. A company that requires significant amounts of machinery to operate (i.e. oil drillers) typically have greater book value than service companies where the workforce is the main value to operations (i.e. software).

† Indices used to represent asset classes: 
U.S. Large Cap Stocks – S&P 500
U.S. Small Cap Stocks – Russell 2000
International Stocks – MSCI ACWI ex-U.S.
U.S. Bonds – Bloomberg Barclays Aggregate
Commodities – Bloomberg Commodity

Important Information

The information presented here is not specific to any individual’s personal circumstances.

To the extent that this material concerns tax matters, it is not intended or written to be used, and cannot be used, by a taxpayer for the purpose of avoiding penalties that may be imposed by law. Each taxpayer should seek independent advice from a tax professional based on his or her individual circumstances.

These materials are provided for general information and educational purposes and represents Wilson Capital’s views based upon publicly available information from sources believed to be reliable—we cannot assure the accuracy or completeness of these materials. The information in these materials may change at any time and without notice.

Wilson Capital is a Registered Investment Advisor (“RIA”), registered in the state of Massachusetts. Wilson Capital provides asset management and related services for clients nationally. Wilson Capital will file and maintain all applicable licenses as required by the state securities boards and/or the Securities and Exchange Commission (“SEC”), as applicable. Wilson Capital renders individualized responses to persons in a particular state only after complying with the state’s regulatory requirements, or pursuant to an applicable state exemption or exclusion.


3Q19 Investment Letter

We feel investors should have an information outlet for the financial markets that is thorough, but does not require a prerequisite degree in economics. We hope this makes our commentary informative and educational for all levels of investors.

Quarter in Review

Asset Class†3rd Quarter 2019 ReturnPast 12 Months
U.S. Bonds2.3%10.3%
U.S. Large Cap Stocks1.7%4.3%
International Stocks-1.8%-1.2%
Commodities-1.8%-6.6%
U.S. Small Cap Stocks-2.4%-8.9%

The stock market movements during the 3rd quarter of 2019 were much like the variable weather during that time of year. Many days were like beach days when the U.S. stock market was relatively calm and unchanged, while other days had major movements seemingly out of nowhere, like a thunderstorm rolling in with the late summer heat. This pattern has served as a reminder to not get too comfortable in this mature bull market. In the end, the S&P 500 notched a positive return for the third quarter, adding gains to what is the best start to a year through nine months since 1997. However, increased volatility for smaller U.S. companies and foreign markets that have continually lagged behind large U.S. companies have created a much less uniform landscape for stocks as a whole. 

In the Headlines: Politicians and Market Perspectives

Despite the high volatility in the markets, it pales in comparison to the volatility of the political circus that is consuming the media outlets these days. It is hard to tell how the Trump impeachment proceedings will play out between now and the election next fall, but one early winner is Elizabeth Warren as her move to the top of the Democratic primary polls has coincided with the start of impeachment hearings. Warren’s position is further strengthened as impeachment will almost certainly hinder Trump’s re-election prospects and at the same time could also affect Joe Biden’s prospects if his Democratic rivals use his son’s involvement with Ukraine against his candidacy as well. All this political news is important within the context of the investment markets because while Trump and Biden are the two biggest free market proponents out of the top 5 current candidates (Bernie Sanders, Kamala Harris and Elizabeth Warren round out the five), Warren has made many campaign promises to make sweeping changes to our current economic system.  The coming months should be interesting as candidates continue to strengthen and verbalize their platforms, including their thoughts on the market and plans for the future.

Looking Ahead: Stocks Not Following Previous Signs of Recession

Unlike the last two most recent recessions (2001 and 2008), company earnings reflect that this market still has room to grow. This is notable because one important piece missing from a potential looming recession is a de-coupling or separation of the growth trajectories of stock returns and the underlying earnings reported by companies.

To zoom out a bit, the relationship between the return of a company (how much the stock price rises or falls) and the earnings of that company (how much money the company makes) have historically been a good yardstick to measure the desirability of that company as an investment. Indexes, such as the S&P 500, are groups of companies that make up a certain market, which in the S&P 500’s case, are 500 large U.S. companies. The makers of the indexes provide the total earnings made by all the companies within the index in order to show how well the underlying companies are performing relative to how much the index is rising or falling each day in the market.

Since market return performance and the underlying earnings of a company are independent of each other, they do not always move in tandem and tend to fluctuate depending upon many factors such as the state of the overall economy and the future outlook of individual company prospects. As a rule of thumb, the market returns are usually higher than the earnings during boom times with expectations of future growth and are typically lower entering recessions when investors question the solidity of the earnings previously produced. However, over long periods of time, the booms and busts tend to iron out and the market price and the underlying earnings move very closely together.

Getting back to how this relates to our current economy, in the past two recessions (2001 and 2008) a separation has occurred when market returns outpace the underlying earnings as the following chart shows.

Source: YCharts, Standard & Poors

In 2000, the market (in blue) continued to advance higher despite earnings (in orange) not increasing at as fast of a pace, creating a gap between the market growth and earnings growth. 2008 played out a bit differently, as the gap in returns and earnings emerged after the declines in both had already started. Looking at today’s numbers, there isn’t currently a significant gap between the market returns and the underlying earnings, as both have continued to move mostly in tandem especially for the past 3-4 years.

There is no law stipulating that this separation must occur prior to a market downturn, and just because it has not started at this current time, doesn’t mean that it won’t in the coming months. It is however, another piece of data that indicates we are in an unusual period within recent market history where typical indicators are not matching up.

IMPORTANT INFORMATION

† Indices used to represent asset classes: 
U.S. Large Cap Stocks – S&P 500
U.S. Small Cap Stocks – Russell 2000
International Stocks – MSCI ACWI ex-U.S.
U.S. Bonds – Bloomberg Barclays Aggregate

The information presented here is not specific to any individual’s personal circumstances.

To the extent that this material concerns tax matters, it is not intended or written to be used, and cannot be used, by a taxpayer for the purpose of avoiding penalties that may be imposed by law. Each taxpayer should seek independent advice from a tax professional based on his or her individual circumstances.

These materials are provided for general information and educational purposes and represents Wilson Capital’s views based upon publicly available information from sources believed to be reliable—we cannot assure the accuracy or completeness of these materials. The information in these materials may change at any time and without notice.

Wilson Capital is a Registered Investment Advisor (“RIA”), registered in the state of Massachusetts. Wilson Capital provides asset management and related services for clients nationally. Wilson Capital will file and maintain all applicable licenses as required by the state securities boards and/or the Securities and Exchange Commission (“SEC”), as applicable. Wilson Capital renders individualized responses to persons in a particular state only after complying with the state’s regulatory requirements, or pursuant to an applicable state exemption or exclusion.


2Q19 Investment Letter

We feel investors should have an information outlet for the financial markets that is thorough, but does not require a prerequisite degree in economics. We hope this makes our commentary informative and educational for all levels of investors.

Asset Class† 2nd Quarter 2019 ReturnPast 12 Months
U.S. Small Cap Stocks2.1%-3.3%
U.S. Large Cap Stocks4.3%10.4%
International Stocks3.0%1.3%
Commodities-1.2%-6.8%
U.S. Bonds3.1%7.9%

Quarter in Review

The 2nd quarter provided a bit of a breather for stock investors as returns were far less volatile than the previous quarter’s big swings. While stocks were relatively placid, the downward move in interest rates caused bond markets to rally (interest rates move inversely to bond prices). Interest rates now stand near their 3-year lows, reversing the steady increase in rates which had reflected a sentiment that the economy had reached sound footing. 

Among the biggest stories in the 2nd quarter were the large number of Initial Public Offerings (IPOs) that hit the market. According to IPO gurus Renaissance Capital, the 63 IPOs in 2nd quarter of 2019 represented the most in one quarter in over 4 years. So far in 2019 many familiar companies have debuted, including ride-sharing companies Uber and Lyft, pet food supplier Chewy, and social media company Pinterest. Perhaps the most exciting company to go public was Beyond Meat, the plant-based meat maker looking to upend how carnivores eat. The stock (ticker: BYND) started trading at $25/share and rocketed up over $200/share, eventually ending the quarter around $160/share. A wild ride that indicates stock market investors still have an appetite for risk 10 years into a bull market. 

Interest Rates, the Economy, and the Stock Market

The continual rise in the stock market in the U.S. since the 2008 financial crisis can be attributed to many factors both at the macro (e.g. continually low unemployment and inflation) and micro (e.g. innovation and a healthier banking system) levels, however at this stage in this bull cycle, interest rates are taking center stage. Two important indicators are the spread of rate between short-term and long-term bonds and the Federal Reserve’s rate decision. 

Rate Spread

Common sense says that the rate demanded from a longer-term bond should always be higher than that of a shorter-term bond, all else being equal. In economic terms this is called the yield curve premium and such a scenario exists during most points in the economic cycle. In simplistic terms, a loan (or bond) due a number of years from today is riskier than that of one due in the coming weeks or months. You may lend a friend money if they say they’ll pay it back tomorrow, but you may be less willing if they tell you they want to pay you back next year.

However, there is a scenario where interest rates for both short and long term rates converge or even flip, where interest rates on longer-term borrowings are lower than those rates for the shorter-term, which is called an inverted yield curve. This has little to do with the borrower’s ability to re-pay the loan, but rather a perception by those in the market that interest rates will continue to decline. This perception is a signal by the bond market that the economy will weaken.

As the chart below illustrates, the last two instances where the yield curve inverted were just prior to recessions (gray bars). While the curve has not entered inverted territory yet, it is nearing that mark.

Chart from YCharts, Source: Federal Reserve

Federal Funds Rate

The current state of affairs with the Federal Reserve looks more like a remake of a classic thriller rather than a new script–and if it is indeed a remake, the bull market may be losing some oxygen.

As a review, interest rates had been very low following the 2008 financial crisis until late 2015 when the Federal Reserve wanted to combat the effects of an ailing economy. By lowering rates, the Federal Reserve was able to combat high unemployment which encouraged spending since lower rates make it “cheaper” to finance business expansion and big-ticket household purchases like housing. While the lower rates can act to spur growth, it is often accompanied by the undesirable effect of increased inflation.

However, inflation had been benign enough to allow the Fed to keep their rate at near-zero. Then in late 2015, as unemployment was no longer a threat to a healthy economy and inflation started ticking up, the Fed began making steady increases to their target interest rate. This policy seemed to be working by gently suppressing the economy in order to avoid a bubble that could lead to a crash. However, as the stock market tumbled in late 2018, some (including President Trump) questioned the policy of rising rates as market prospects dimmed and inflation has remained relatively tame.

This has led the market to anticipate the Fed is done raising rates and even potentially cutting rates to boost the economy. 

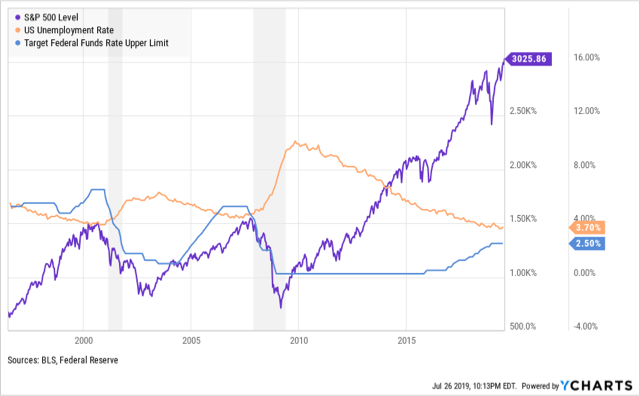
While the timing and actors involved have changed in each economic cycle, the current scenario is surprisingly nearly identical to the past two recessions in our economy. As the chart below shows, in both 2000 and 2007, just before recessions hit the U.S. economy, the Fed lowered rates despite unemployment remaining low.

Chart from YCharts, Sources: Federal Reserve, Bureau of Labor Statistics

Some take-aways from this scenario are: 

  1. Despite the intent of the Fed to maintain a policy course for low employment and inflation, it seems as though the stock market performance does play a role in their policy, especially in the periods just prior to, and after, a recession.
  2. The Fed and their ability to set interest rates may not be powerful enough to combat an economy at the late stages of a bull market cycle.
  3. The Fed has the unenviable job of trying to reduce market exuberance to avoid a crash, but in doing so, they could easily be viewed as the reason for a market downturn. 

While this commentary on interest rates paints a dismal picture of the future of the current bull market, it is not necessarily an indication that a recession is around the corner. Other statistics such as consumer sentiment and personal savings rates are at levels that indicate that the economy is still on sound footing. Searching for the pothole that leads to the next market crash has become a sport to market commentators (this commentator included). Statistics and trends that have occurred in previous downturns will likely play a large role in the next downturn, but the markets are constantly evolving, making it very difficult to predict the future.

Glossary

Federal Reserve – The United States’ central bank, which is responsible for regulating the banking industry and controlling the money supply through monetary policy.

Federal Funds Rate – Interest rate used by the largest banks to lend money in the shortest time periods, usually overnight.

† Indices used to represent asset classes: 
U.S. Large Cap Stocks – S&P 500
U.S. Small Cap Stocks – Russell 2000
International Stocks – MSCI ACWI ex-U.S.
U.S. Bonds – Barclays Aggregate
Commodities – Bloomberg Commodity

IMPORTANT INFORMATION

The information presented here is not specific to any individual’s personal circumstances.

To the extent that this material concerns tax matters, it is not intended or written to be used, and cannot be used, by a taxpayer for the purpose of avoiding penalties that may be imposed by law. Each taxpayer should seek independent advice from a tax professional based on his or her individual circumstances.

These materials are provided for general information and educational purposes and represents Wilson Capital’s views based upon publicly available information from sources believed to be reliable—we cannot assure the accuracy or completeness of these materials. The information in these materials may change at any time and without notice.

Wilson Capital is a Registered Investment Advisor (“RIA”), registered in the state of Massachusetts. Wilson Capital provides asset management and related services for clients nationally. Wilson Capital will file and maintain all applicable licenses as required by the state securities boards and/or the Securities and Exchange Commission (“SEC”), as applicable. Wilson Capital renders individualized responses to persons in a particular state only after complying with the state’s regulatory requirements, or pursuant to an applicable state exemption or exclusion.


1Q19 Investment Letter

We feel investors should have an information outlet for the financial markets that is thorough, but does not require a prerequisite degree in economics. We hope this makes our commentary informative and educational for all levels of investors.

Quarter in Review

Asset Class†1st Quarter 2019 ReturnPast 12 Months
U.S. Small Cap Stocks14.6%2.1%
U.S. Large Cap Stocks13.7%9.5%
International Stocks10.3%-4.2%
Commodities6.3%-5.3%
U.S. Bonds2.9%4.5%

Talk about turning the page to a new year! January proved to be as euphoric for markets as December had been gloomy. Stock markets across the globe roared higher and with interest rates falling to their lowest levels in years, bonds also notched a positive return (bond prices increase as interest rates fall). The 1st quarter of 2019 was the best quarterly return for the S&P 500 in 9 years, a big surprise after the 4th quarter of 2018 which was the worst quarter for the S&P 500 in nearly 8 years.

Unemployment remains at near record low levels and inflation continues to be muted, creating a scenario where the Federal Reserve has signaled it is content with current interest rates. Indeed, after the Federal Reserve’s January meeting, officials noted that a pause in interest rate hikes posed ‘few risks’ for the U.S. economy, a welcome sign for stock investors worried that higher interest rates would act as a wet blanket to corporate profits.

Reflecting on the Jekyll & Hyde Markets

Given the aforementioned about-face in market results and sentiment, it is worth taking a gut-check on how these movements affect the psyche of investors and the pitfalls that can occur if market movements dictate an investment strategy. The contrast in the results of the stock market between 4th quarter 2018, with its swift decline and wild daily swings, and the 1st quarter 2019, with its slow and steady upward march, allows for a great demonstration on how to digest the results and not let them affect long-term planning. This is especially important in the context of market timing and also the application of behavioral economics.

Market Timing

If it was an easy way to predict on any given day or even week when a market is about to make a big move, the investment management industry would not exist.  In reality, markets move in much larger cycles and the goal of most professional investors is to gauge the change in tide rather the size of individual waves. In times of high volatility, panicked reactions can prove even more costly to the investor as days of large declines are often followed by days of large rebounds.

The market had two swift declines of more than 3% in 2018, in mid-October and again in early December. Below are the results of those two periods:

Period# of 1% + positive days in 20 Trading Days After 3% decline# of 1% + negative days in 20 Trading Days After 3% declineReturn 20 days following 3% declineReturn 40 days following 3% decline
Mid-October (10/10/18)741.0%-5.5%
Early December (12/4/18)28-6.2%.9%

This table shows that in the 20 days following a 3% decline in 2018, the subsequent 20 days of trading were more volatile than normal with large moves in both directions. Furthermore, in these two instances from 2018, the medium-term results (weeks to months) played out in the opposite manner from October (positive after 20 days, but negative after 40) to December (negative results after 20 days, but positive results after 40 days).  These varied results make finding the optimal re-entry point challenging, something required in successful market timing.

Behavioral Economics

The second significant issue with making investment decisions due to a decline is how the increase in volatility, which tends to rise significantly during periods of decline, affects human’s ability to react rationally.  Over the years these Investment Letters have spoken extensively about the emergence of behavior economics–the basic idea that the science of economics cannot be fully explained by numbers since humans are not always rational. This is especially evident in periods of decline. The below chart shows the S&P 500 (U.S. stocks, in blue) against the VIX, which is an indicator of the level of volatility for the past year (in orange).

As the chart indicates, the market increased with low volatility, but decreased with high volatility. This behavior can play tricks with investors’ minds in many ways. In periods of steady increases, portfolio value increases may not be noticeable and less attention will be paid to the market by the media. Declines, however spark our fight or flight triggers as account values drop and fluctuate, while at the same time the market becomes front page news. This can create doubt and fear at an individual level that is simply not warranted for a long-term investment horizon.

Much like an athlete cannot replicate the emotions of a game in practice, investors cannot replicate the emotions encountered with a swift decline. This doesn’t mean investors can’t “practice” better. Take notes of your emotions during times of market declines or volatility and compare those notes to your emotions weeks or months later.

References and Links

Behavioral Economics – Here are a couple of links to articles discussing how behavioral economics interacts with investment decisions:

Opinion: 12 Things You Can Learn About Investing from Nobel Prize Winner Richard Thaler

How Investor Behavior Gets in the Way of Success

† Indices used to represent asset classes:
U.S Large Cap Stocks — S&P 500
U.S. Small Cap Stocks — Russell 2000
International Stocks — MSCI ACWI ex-U.S.
U.S. Bonds — Bloomberg Barclays Aggregate
Commodities — Bloomberg Commodity

Important Information

The information presented here is not specific to any individual’s personal circumstances.

To the extent that this material concerns tax matters, it is not intended or written to be used, and cannot be used, by a taxpayer for the purpose of avoiding penalties that may be imposed by law. Each taxpayer should seek independent advice from a tax professional based on his or her individual circumstances.

These materials are provided for general information and educational purposes and represents Wilson Capital’s views based upon publicly available information from sources believed to be reliable—we cannot assure the accuracy or completeness of these materials. The information in these materials may change at any time and without notice.

Wilson Capital is a Registered Investment Advisor (“RIA”), registered in the state of Massachusetts. Wilson Capital provides asset management and related services for clients nationally. Wilson Capital will file and maintain all applicable licenses as required by the state securities boards and/or the Securities and Exchange Commission (“SEC”), as applicable. Wilson Capital renders individualized responses to persons in a particular state only after complying with the state’s regulatory requirements, or pursuant to an applicable state exemption or exclusion.


4Q18 Investment Letter

We feel investors should have an information outlet for the financial markets that is thorough, but does not require a prerequisite degree in economics. We hope this makes our commentary informative and educational for all levels of investors. 

Quarter in Review

Asset Class†4th Quarter 2018 ReturnPast 12 Months
U.S. Bonds1.6%0.0%
Commodities-9.4%-11.3%
International Stocks-11.5%-10.8%
U.S. Large Cap Stocks-13.5%-4.4%
U.S. Small Cap Stocks-20.2%-11.0%

If the recent quarters of steady returns and low volatility were starting to make investors yawn, the 4th quarter was certainly a wake up call. While stock markets were down starting in October, December was particularly bad with the S&P 500 posting its worst December return since 1931. The negative returns were especially prominent in the week leading up to Christmas, which runs counter to the usual “Santa Claus Rally”* and yuletide cheer quickly turned into the Nightmare Before Christmas for stock investors. Conversely, the gradual rise in interest rates took an abrupt reverse as well, with most interest rates dropping to their lowest levels in 2018 giving bond investors something to cheer about, since interest rates move in the opposite direction as bond prices.

The negative market movement of this past December also came as a surprise because most financial news remains positive with no obvious cracks to the foundation of the economy. Yes, the trade war with China, the Federal Reserve’s intention to gradually rise interest rates and the longest bull market on record are all  issues in the headlines that raise concerns, but on the other hand U.S. employment continues to be robust and inflation is largely sanguine.

The first weeks of January seem to have investors focusing more on this positive news with stocks regaining much of the footing lost in December.

Reflections on Recent Market Declines

For starters, it is important to note that the rapid declines of the stock market in the 4th quarter do not portend a 2008-like financial crisis. Even a month into 2019, we’re seeing markets rebound as investors focus on the positive news.  That is not to say that this 4th quarter decline was only temporary or that stocks are finished falling, but rather that our current economic landscape is much different now than it was in 2008. The declines in 2008 were due to the failure of the debt market fueled by wild speculation which created a contagion that rippled across all areas of finance, since the availability and cost of debt is relevant to all areas of the economy.

Just because there may not be a domino-effect atmosphere like there was in 2008 does not necessarily mean that trouble is not brewing. As noted above, the ongoing (as of this writing) trade war with China is starting to show its effects on company results with several companies, including Apple, indicating that profits will be lowered in some part due to the tariffs. What appears most likely is that the political scene (only exasperated by the government shutdown) coupled with an historically long period of prosperity could create a tinder box scenario where a piece of bad economic or political news creates a spark that inflames the markets, though likely in a more temporary manner than what we saw in 2008.

On top of the cloudy political atmosphere, the volatile trading in December highlighted that computerized trading plays a significant role in today’s market where market movements are increasingly disconnected from fundamentals, making predictions of future moves even more challenging.

In the Headlines: Computer trading

As noted in the Quarter In Review section above, the recent declines were odd not only for how quickly they came on, but also for the timing of the drop in mid-late December. Like many businesses, the second half of December is usually a quiet time for Wall Street. It was a shock then to see such incredible volatility and volume at a time when many people are not working or away for the holidays. The culprit appears to be computerized trading.

The fact that the market made such a big move at a time when there are typically few trades being made raised some eyebrows. An article in the Wall Street Journal on December 27th,* took a closer look at the issue. The article focused on a recent a JP Morgan report that 85% of the market trading is automated by computers, much of which is tied to the momentum of the market. This means that a change in the market direction, coupled with fewer human traders in the market could lead to swift and meaningful moves in the market.

The rise in computerized trading in the past decade has been widely publicized most notably with the Michael Lewis book, Flash Boys. In short, there are a number of investors who make money by creating computer algorithms with the intent to make money based solely on the computer code. The results of this behavior have shown up a few times in recent years, most notably the flash crash of 2010*, but largely hides in the shadows.

It may take some time for this sea of change to take hold in the markets, but if December is an example of how it can come into play, we may need to buckle our seat belts for near-term market volatility.

Glossary and Article Links

Santa Claus Rally – Stock market phenomenon, first noted in the Stock Trader’s Almanac in the 1970’s, where returns in the week following Christmas are significantly more positive than negative. Potential reasons this has occurred include new cash entering the market following Christmas and the larger proportion of retail trading.

Flash Crash – Was a sudden downturn in the stock market in during the afternoon of May 6th 2010 without any significant news reports. Various studies were commissioned after the crash with most pointing to an imbalance in trading orders where there were many more investors looking to sell than there were investors looking to buy. 

December 25, 2018, WSJ.com Behind the Market Swoon: The Herdlike Behavior of Computerized Trading

† Indices used to represent asset classes:
U.S. Large Cap Stocks – S&P 500
U.S. Small Cap Stocks – Russell 2000
International Stocks – MSCI ACWI ex-U.S.
U.S. Bonds – Barclays Aggregate
Commodities – Bloomberg Commodity

IMPORTANT INFORMATION

The information presented here is not specific to any individual’s personal circumstances.

To the extent that this material concerns tax matters, it is not intended or written to be used, and cannot be used, by a taxpayer for the purpose of avoiding penalties that may be imposed by law. Each taxpayer should seek independent advice from a tax professional based on his or her individual circumstances.

These materials are provided for general information and educational purposes and represents Wilson Capital’s views based upon publicly available information from sources believed to be reliable—we cannot assure the accuracy or completeness of these materials. The information in these materials may change at any time and without notice.

Wilson Capital is a Registered Investment Advisor (“RIA”), registered in the state of Massachusetts. Wilson Capital provides asset management and related services for clients nationally. Wilson Capital will file and maintain all applicable licenses as required by the state securities boards and/or the Securities and Exchange Commission (“SEC”), as applicable. Wilson Capital renders individualized responses to persons in a particular state only after complying with the state’s regulatory requirements, or pursuant to an applicable state exemption or exclusion.


3Q18 Investment Letter

We feel investors should have an information outlet for the financial markets that is thorough, but does not require a prerequisite degree in economics. We hope this makes our commentary informative and educational for all levels of investors. 

Quarter in Review

Asset Class† 3rd Quarter 2018 Return
Past 12 Months
U.S. Large Cap Stocks 7.7% 17.9%
U.S. Small Cap Stocks 3.6% 15.2%
International Stocks 0.7% 1.8%
U.S. Bonds 0.0% -1.2%
Commodities -2.0% 2.6%

The returns for the stock market in the 3rd quarter hardly appear to be those from a bull market in its 10th year.  The S&P 500 returned just shy of 8% for the quarter had the best quarterly showing from this index since the 4th quarter of 2013.

Unfortunately, those were the results from the 3rd quarter and the 4th quarter has blown in with an entirely new agenda. Much of the 3rd quarter’s results can be explained by the continually strong corporate earnings and a robust job market. However, the considerable headwinds which include rising oil prices (highest prices since late 2014), a war on free trade, and the U.S. Federal Reserve* raising interest rates for a 3rd time this year have all started to spook investors at the start of the 4th quarter.

The market performance at the start of the 4th quarter has been noted by many news outlets as including “surging volatility” and “market plunges…sparking fears”. While, not exactly “ho-hum” a two day decline of -5.3% isn’t radically outside of the norm. In fact, since the bull market began in April 2008 there have been 6 occasions where the two-day return was worse than the -5.3% we saw on the second week of October, with the 4th quarter just getting underway. While we would always prefer the markets maintain a steady upward trajectory, it is important not to get wrapped up in journalistic hype when the tides are not in our favor.

In the Headlines: Rising Interest Rates

The fact that the Federal Reserve is raising interest rates is not a huge surprise to investors as this is the typically antidote to low unemployment and rising inflation, both of which are present in today’s economy. However, due to the length and robustness of the current bull market, the surprise may come in the outcome of what continually raising rates does to this current economic period where low interest rates have allowed nearly every aspect of the economy to prosper, from middle-income homeowners to our federal government. Will a reduction of easy money provide a soft landing that allows the economy to continue to grow albeit at a lower rate, or will it be a shock that marks the start of a recession? At this point there are arguments for both camps.

Positive Effects of Higher Interest Rates

Prevents runaway inflation. By raising interest rates, The Fed is aiming to keep inflation from increasing too much. While some inflation is part of a healthy economy (1%-3%), rapidly growing inflation can have disastrous effects. Rising inflation means that consumers and businesses have reduced purchasing power, meaning a dollar today is worth less than it will be tomorrow. When inflation starts rising rapidly the increased cost of goods may be quite noticeable, which can change buying habits and turn into a self-fulfilling prophecy leading to even more inflation. The past 30 years have been a period of extremely tame inflation in the U.S. when compared to the much longer history dating back to the early 20th century. Inflation above 10% was a normal occurrence for much of the 20th century, but was last seen in the early 1980’s.

Best way to regulate a hot stock market.   Related to the inflation argument, raising interest rates can act as a way of cooling down a hot stock market. As interest rates rise, investors are enticed by the increased yield on bonds thus reducing the amount of people buying stocks. It may seem counterproductive to try to reduce the growth in the stock market to strengthen the economy, but much like the inflation argument, an untethered market can lead to wild swings with of boom and bust, which can inflict significant pain in the long-term.

Negative Effects of Higher Interest Rates

Increasing the cost of debt hamstrings commerce–from households to big governments.  In all of the talk surrounding the Fed’s raising or lowering of rates it is rarely pointed out how these actions can impact every aspect of the economy. Directly, higher interest rates can affect the number of cars sold and the prices of houses since both purchases are often made with debt and a higher interest rate will make those purchases more expensive. In the corporate world, nearly all companies are financed with debt and if that debt becomes more expensive, companies may feel the strain be less likely to expand operations. On top of the effects on the consumer, our entire government is run by debt financing…some $21Trillion of it. Higher rates mean that each dollar borrowed by the U.S. treasury is more expensive. That expense needs to be paid either through higher taxes or reduced spending, two policy outcomes that neither political party has shown great strength in administering correctly.

Conclusions

While we can look at both the pros and cons to the results of raising interest rates, the crucial question is whether the timing of the current rate increases is appropriate. If the Fed is prescribing medication in the form of higher rates for what is only a perceived illness (overheating stock market and inflation) the result of this reaction could be more dire than no action at all. The key will be watching how nimbly the Fed reacts to market movement. The U.S. is at a time where careful consideration and possibly a reversal in policy may be what the economy really requires. The next 3-6 months should be an important period in watching their course of action.

Glossary and Article Links

Federal Reserve – The United States’ central bank, which is responsible for regulating the banking industry and controlling the money supply through monetary policy.

October 11, 2018, Forbes.com: “Market Volatility is Surging” by Jesse Columbo

October 10, 2018, NBCNews.com: “Dow Jones plunges 800 points as higher rates spark fears” by Lucy Bayly

† Indices used to represent asset classes:
U.S. Large Cap Stocks – S&P 500
U.S. Small Cap Stocks – Russell 2000
International Stocks – MSCI ACWI ex-U.S.
U.S. Bonds – Barclays Aggregate
Commodities – Bloomberg Commodity

IMPORTANT INFORMATION

The information presented here is not specific to any individual’s personal circumstances.

To the extent that this material concerns tax matters, it is not intended or written to be used, and cannot be used, by a taxpayer for the purpose of avoiding penalties that may be imposed by law. Each taxpayer should seek independent advice from a tax professional based on his or her individual circumstances.

These materials are provided for general information and educational purposes and represents Wilson Capital’s views based upon publicly available information from sources believed to be reliable—we cannot assure the accuracy or completeness of these materials. The information in these materials may change at any time and without notice.

Wilson Capital is a Registered Investment Advisor (“RIA”), registered in the state of Massachusetts. Wilson Capital provides asset management and related services for clients nationally. Wilson Capital will file and maintain all applicable licenses as required by the state securities boards and/or the Securities and Exchange Commission (“SEC”), as applicable. Wilson Capital renders individualized responses to persons in a particular state only after complying with the state’s regulatory requirements, or pursuant to an applicable state exemption or exclusion.

Click here to download a PDF of this Investment Letter  3Q18-Investment-Letter-Final.pdf (532 downloads)


2Q18 Investment Letter

We feel investors should have an information outlet for the financial markets that is thorough, but does not require a prerequisite degree in economics. We hope this makes our commentary informative and educational for all levels of investors. 

Quarter in Review

Asset Class† 2nd Quarter 2018 Return Past 12 Months
U.S. Small Cap Stocks 7.8% 17.6%
U.S. Large Cap Stocks 3.4% 14.4%
Commodities 0.4% 7.4%
U.S. Bonds -0.2% -0.4%
International Stocks -2.6% 7.3%

The second quarter of 2018 was a reversal from the beginning of the year, as domestic stocks bounced back from negative returns and were also less volatile. The story is largely the same for bonds. While interest rates still rose over the course of the quarter, they leveled out considerably, resulting in a much smaller decline in their overall return (bond prices move inversely with interest rates).

As the U.S. economy continues to chug along, investors continue to keep an eye on the Federal Reserve’s future policy moves to ensure that the economy does not overheat. The two biggest factors in gauging their moves are the employment numbers and inflation. Usually, investors look for a combination of low unemployment and increasing inflation to predict a change from the Fed.  The unemployment rate continued to fall during the second quarter, reaching 3.8% in May, which is the lowest point since 2000, while inflation which had been accelerating higher in past quarters has leveled out. Such a combination has many thinking we are in a “goldilocks” period where the economy isn’t too hot nor too cold, meaning the Fed won’t make any significant changes to the expectations of 1 or 2 more rate increases in 2018. Workers’ earnings are one measure that is a bit confounding. While inflation of the prices of goods and services have been increasing, wage growth for workers has not been keeping pace.

While overall inflation has been more subdued in the most recent months, consumers are starting to feel a little more pain at the pump as oil prices have reached their highest level since late 2014, right before the U.S. “fracking” boom.

In the Headlines: Free Trade

This quarter marked a significant shift in U.S. approach to trade policy. After decades of moves by the U.S. to further free trade with other countries, the Trump administration has made a point to expose what they perceive as unfair practices that hurt domestic businesses by implementing tariffs, most notably to China, the largest trading partner with the U.S. This change and the resulting effects to consumers is worth a deeper look.

History of U.S. and free trade

A history of American free trade deserves a space much larger than a single paragraph, but there are a few significant factors that have led to the U.S. embrace of free trade policy, namely globalization and shifts in employment trends. In the last half-century the U.S. has also evolved from a largely industrial and agrarian economy to a service based economy, where in the simplest terms, we are purchasers (importers) of goods and sellers (exporters) of human capital or ideas. With advancements in transportation and technology, it has become increasingly easier and cheaper for wealthy countries to outsource much of their goods and agriculture to regions outside of their own borders.

How things have changed

The U.S. consumer has been a significant beneficiary of free trade practices as Americans are able to buy goods that require a less-skilled workforce at much cheaper prices than they would if they were produced state-side. Much of the backlash to free trade in recent years has focused on working conditions and sweatshops, a belief that yes, the U.S. consumer benefits, but at the detriment to workers in a far-away land.

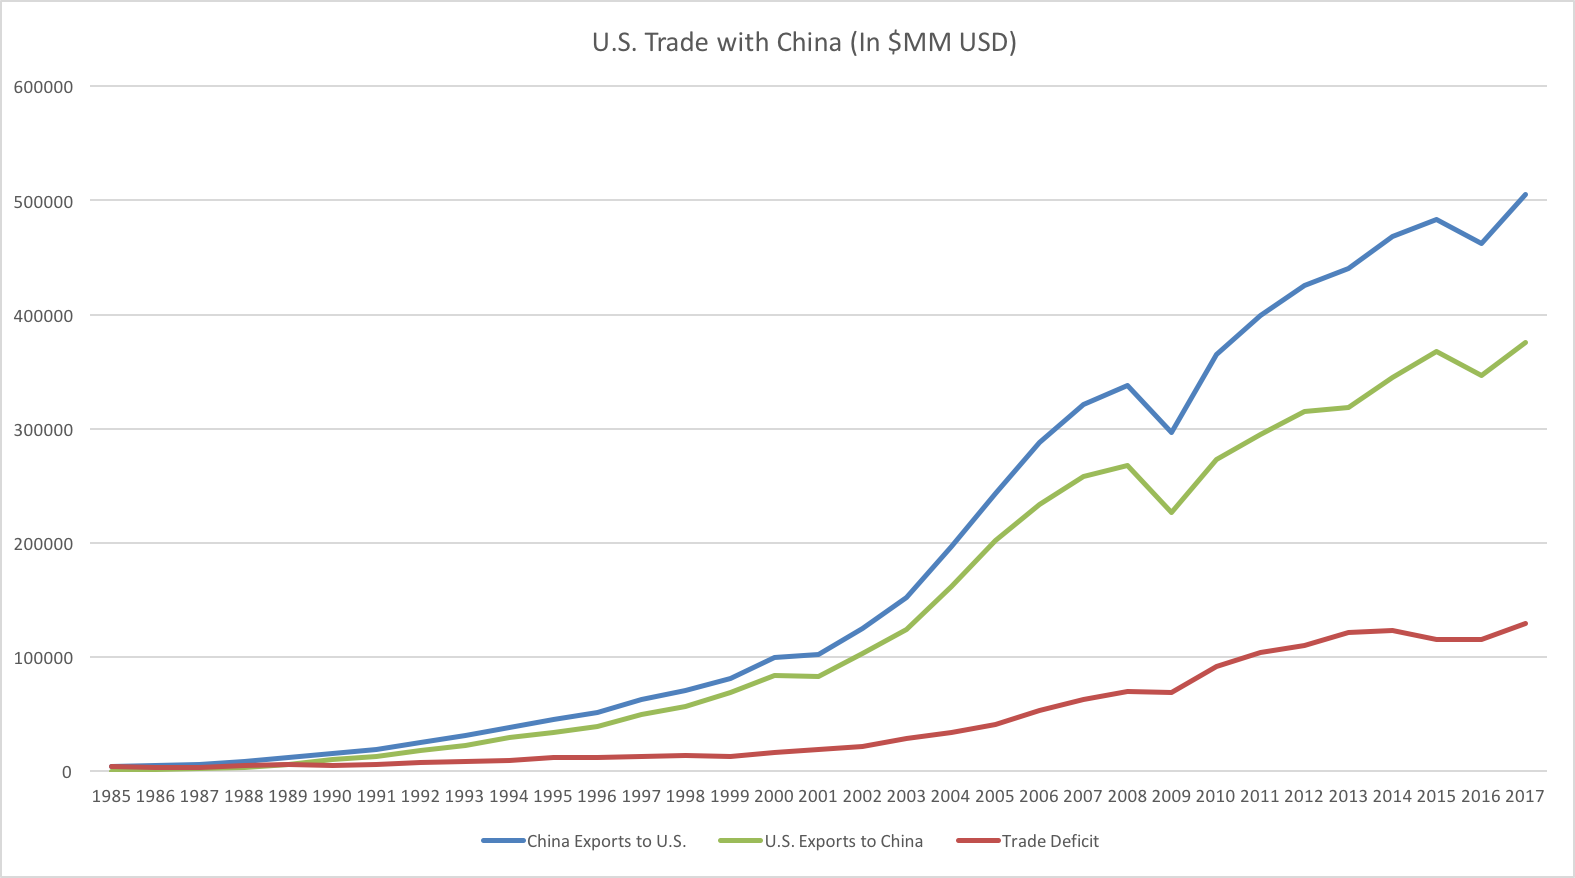
The Trump administration however views our reliance on trade, especially with China, in a much different light. Since 1985, the trade deficit between the two countries has continued to grow and the expanding gap, says the Trump administration, is having adverse effects on the U.S. economy, namely job losses in manufacturing and infringement on U.S. intellectual property.

Source: US Census Bureau

While China’s stronghold on manufacturing is reducing the number of jobs in U.S. and disrupting the workforce, many economists view this as a temporary issue, as any job losses in manufacturing will be shifted to other industries. This is little solace to U.S. manufacturing workers, especially those in the late part of their careers where learning new skills is increasingly difficult. Erecting stronger trade barriers, says the Trump administration, will save many of those jobs as companies will find it cheaper to produce some goods in the U.S.

There is also the perception that China’s trade practices are harmful to the intellectual property rights of U.S. companies. As China has become an advanced economic powerhouse, they have become increasingly proficient in producing more advanced goods–especially relating to technology. This advancement has put a spotlight on China’s weak intellectual property laws, which have little respect for design secrets that are protected by U.S. courts.

A specific example of this involves the F-35 fighter jet made by U.S. company Lockheed Martin. In 1999 Chinese hackers were able to steal design secrets from Lockheed and a government-owned defense company has since created a similar jet, the J-31, which is believed to be a “knock-off” of the F-35 jet. Such practices are highly illegal in the U.S., but fall in to a much more gray area in China. The Trump administration believes the tactics used in the reproduction of the F-35 as the J-31 are the tip of the iceberg for future infringement of U.S. goods.

What this means

There are truths to all sides of this issue. Free trade with countries like China has been incredibly beneficial to the U.S., but the concerns outlined by the Trump administration are also valid. In the short term, the tariffs will likely have only slight repercussions on the U.S. consumer, especially if they are short-term in nature and have the intended effect of making China rethink many of its current practices that harm U.S. companies. However, if this mindset of creating a more level playing field continues for months or years, the effects could be significant in the form of higher inflation, lower profits for companies and a reduction of the U.S’s sway in the global stage. At this point it is hard to determine whether Trump’s bet on China acquiescing will pay off, but it is certainly a disruption of the status quo, something that Trump has found to be his calling card.

IMPORTANT INFORMATION

The information presented here is not specific to any individual’s personal circumstances.

To the extent that this material concerns tax matters, it is not intended or written to be used, and cannot be used, by a taxpayer for the purpose of avoiding penalties that may be imposed by law. Each taxpayer should seek independent advice from a tax professional based on his or her individual circumstances.

These materials are provided for general information and educational purposes and represents Wilson Capital’s views based upon publicly available information from sources believed to be reliable—we cannot assure the accuracy or completeness of these materials. The information in these materials may change at any time and without notice.

Wilson Capital is a Registered Investment Advisor (“RIA”), registered in the state of Massachusetts. Wilson Capital provides asset management and related services for clients nationally. Wilson Capital will file and maintain all applicable licenses as required by the state securities boards and/or the Securities and Exchange Commission (“SEC”), as applicable. Wilson Capital renders individualized responses to persons in a particular state only after complying with the state’s regulatory requirements, or pursuant to an applicable state exemption or exclusion.

Click here to download a PDF of this Investment Letter 2Q18-Investment-Letter-Final-72318.pdf (507 downloads)