1Q18 Investment Letter

We feel investors should have an information outlet for the financial markets that is thorough, but does not require a prerequisite degree in economics. We hope this makes our commentary informative and educational for all levels of investors. We have also included a glossary at the end of this commentary that defines terms marked with an asterisk (*).

Quarter in Review

Asset Class† 4th Quarter 2017 Return Past 12 Months
International Stocks -1.2% 16.5%
U.S. Large Cap Stocks -0.8% 14.0%
U.S. Small Cap Stocks -0.1% 11.8%
Commodities -0.4% 3.7%
U.S. Bonds -1.5% 1.2%

After posting nine consecutive quarters of gains, The S&P 500 finally broke its streak in the 1st quarter by posting its first negative quarter since the 3rd quarter of 2015. Along with a negative return, the quarter also ushered in more volatility which included more daily returns of -1% or worse (11) than in all of 2017.

The quarter started out strong, with gains for all equity markets through the month of January. This coincided with strong 4th quarter earnings reports which included mostly rosy guidance of future results due to the forthcoming lower tax rates. All that strength disappeared in an instant with the January jobs announcement by the U.S. Labor Dept. on February 2nd.  On the surface, the report was stellar; Higher than projected hires were accompanied by an increase in hourly earnings to its highest year-over-year rate since 2009. While undoubtedly positive news for the labor force, the announcement added to the speculation that the Federal Reserve* will continue to raise interest rates, which increases the borrowing costs for companies. In response, U.S. treasury interest rates, which affect interest rates on everything from savings accounts to mortgages, rose to their highest levels in 4 years.

Further consternation in the markets arose in March when Facebook announced the misuse of data by a third party, breaching the privacy of its users. While it is no surprise that Facebook makes its money by selling its users’ data, the lack of controls within the company increased concerns that the “selling the data” model used by many in the tech world today is built on a weak foundation that could lead to continued messy outcomes.

Outlook

As mentioned above, the early results of the tax reform passed in late 2017 indicate the rise in profitability that was predicted by the supporters of the bill. This has correlated with analysts and economists raising their future profit projections for the stock market. All of this sounds splendid if you are an investor in the stock market, since shareholders are likely to see increased returns. It does however lead to a few questions. Since markets are generally valued on future expectations rather than the past, are the riches associated with the tax law already baked into stock prices? Also, are increased profits derived from a change in legislation a form of financial engineering, since the companies did little to increase investment and productivity?

The Role of Future Expectations

Economists and Brokerage firms are constantly updating their expected earnings per share* (EPS) for individual companies and for the market as a whole. This data is aggregated and widely used to measure the “value” of the market. While past results are used as a base for their projections, it is the future growth that is most widely regarded as the true measure of valuation. These projections are published weekly by Standard and Poors, the company behind the often-cited S&P 500 index. Below is a chart that shows how the expected earnings for 2018 (far right column) changed as 2017 earnings (middle column) went from expected to actual.

Date 2017 EPS 2018 Projected EPS
3/16/17 118.83 130.03
6/22/17 118.46 133.85
9/22/17 114.82 131.23
11/22/17 114.92 132.86
3/15/18 109.88 (actual) 144.58
Source: Standard & Poors

The chart shows how the projections for 2018 EPS have increased substantially in the first quarter of 2018, despite the actual results of 2017 decreasing. While it is likely true that company earnings will continue to increase due to the tax law, it may be acting as a disguise for a corporate environment where growing earnings is becoming increasingly difficult.

Tax Changes as Financial Engineering

This brings us to the financial engineering aspect of the tax law. While the tax code has indeed changed, the operations within companies have not. Parallels can be drawn between tax code results and the trend that has occurred for the past few years where companies have been using their profits to repurchase their own shares. This repurchasing phenomenon has been jocularly called financial engineering because when shares are repurchased, the company is able to report higher earnings per share, not because the true earnings have increased, but rather that the number of shares has declined. Lowering the tax rate now has a similar effect; companies have a smaller tax bill which leads to higher earnings numbers. In order for analysts to continue to raise expectations for market EPS it is going to have to come from innovation and better management at some point.

As 2018 progresses we will get a better idea as to whether the tax cuts will be more than a temporary boost to corporate earnings; something that America needs to continue this already historic bull market*.

Glossary

Federal ReserveThe United States’ central bank, which is responsible for regulating the banking industry and controlling the money supply through monetary policy.

Earnings-Per-Share – The amount of earnings or profit that a company makes allocated for each share that is outstanding in the market for that period.

Bull MarketCenturies old term (along with Bear Market) used to describe positive (Bull) or negative (Bear) market sentiments. The origins are disputed, but the term may be due to bulls lifting their horns upward to attack, while a bear swats its paws downward.

† Indices used to represent asset classes:
U.S. Large Cap Stocks – S&P 500
U.S. Small Cap Stocks – Russell 2000
International Stocks – MSCI ACWI ex-U.S.
U.S. Bonds – Barclays Aggregate
Commodities – Bloomberg Commodity

IMPORTANT INFORMATION

The information presented here is not specific to any individual’s personal circumstances.

To the extent that this material concerns tax matters, it is not intended or written to be used, and cannot be used, by a taxpayer for the purpose of avoiding penalties that may be imposed by law. Each taxpayer should seek independent advice from a tax professional based on his or her individual circumstances.

These materials are provided for general information and educational purposes and represents Wilson Capital’s views based upon publicly available information from sources believed to be reliable—we cannot assure the accuracy or completeness of these materials. The information in these materials may change at any time and without notice.

Wilson Capital is a Registered Investment Advisor (“RIA”), registered in the state of Massachusetts. Wilson Capital provides asset management and related services for clients nationally. Wilson Capital will file and maintain all applicable licenses as required by the state securities boards and/or the Securities and Exchange Commission (“SEC”), as applicable. Wilson Capital renders individualized responses to persons in a particular state only after complying with the state’s regulatory requirements, or pursuant to an applicable state exemption or exclusion.

Click here to download a printable PDF 1Q18-Investment-Letter-Final.pdf (402 downloads)


4Q17 Investment Letter

We feel investors should have an information outlet for the financial markets that is thorough, but does not require a prerequisite degree in economics. We hope this makes our commentary informative and educational for all levels of investors. We have also included a glossary at the end of this commentary that defines terms marked with an asterisk (*).

Quarter in Review

Asset Class† 4th Quarter 2017 Return Past 12 Months
International Stocks 5.0% 27.2%
U.S. Large Cap Stocks 6.6% 21.8%
U.S. Small Cap Stocks 3.3% 14.7%
U.S. Bonds 0.4% 3.5%
Commodities 4.7% 1.7%

2017 proved to be one of the most prolific years on record for stocks around the globe. This marks the 9th straight year with a positive annual return for the U.S. Large Company S&P 500 index and matches the record for the most consecutive years of positive returns since the index was created in 1923. Outside of the U.S., International stocks around the world joined in on the party in a big way this year by returning over 27% as a whole with Emerging Markets, a sub-sector of the international market which includes countries such as China and India, returning 37%.

The positive results continue to be predicated on accommodating Federal Reserve policies for businesses and a Republican political agenda that promotes leniency on regulations. With the unemployment rate at the lowest level in years and consumer confidence at its highest level since the year 2000, the wheels of the economy had been greased for the resulting gains.

Outlook

While equity markets have been roaring higher without taking much of a breath in the past 9 years and interest rates making the sharpest moves higher in a half decade, this is not the time to put the blinders on. There is an old saying on Wall Street that “bull markets don’t die of old age”, but rather by events that might be both sudden and unexpected. The most salient events right now are market bubbles, interest rates, and a blanket category of politics.

Market Bubbles

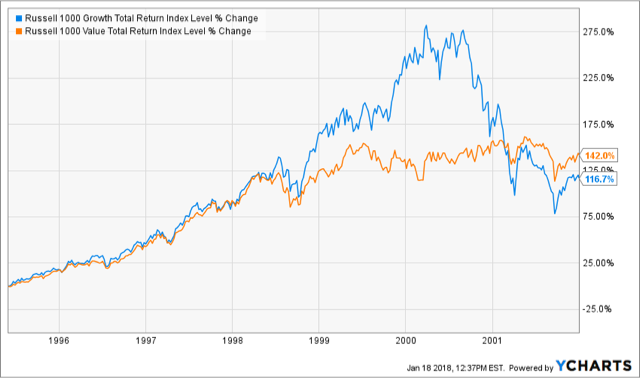
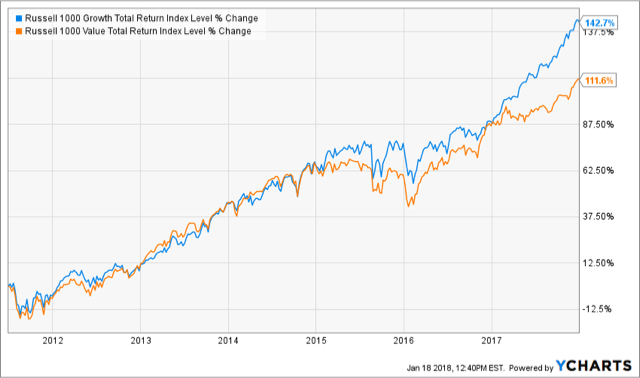
Wilson Capital’s commentary has often chronicled the exuberant growth stocks that have outperformed their value counterparts since the 2008 financial crisis. Since the beginning of 2017, this performance gap has widened considerably, as industries like bio-tech and information technology have soared while more staid industries like energy and consumer retail have lagged. This in itself is not a reason for caution, but could lead to issues if the expectations of future growth fail to materialize. The below charts illustrate the returns of Growth* and Value* stocks in the period during the 2000 tech bubble and the current market. While it is far too early and with the environment much changed than that of the 2000 tech bubble, the charts show an eerie similarity to the period preceding that eventual bubble pop as Growth stocks start to de-couple from Value stocks.

1995-2002
2011-2018

Source: YCharts

In addition to rising stock prices, the recent emergence of crypto-currencies such as Bitcoin does not suggest that investors are eager to be tethered to earth anytime soon. This new investable asset is literally a made-up form of currency without any monitoring authority that has less tangible worth than Monopoly money since it does not exist in physical form. A keen investor would keep an eye on the rationality of the public if the crypto-currency market continues higher.

Interest Rates

Over the course of the past 2 years, the U.S. Federal Reserve has increased the Federal Funds Rate* from its low of 0% up to 1.4% as of December 2017. In the aftermath of the 2008 financial crisis, the Federal Reserve went to drastic measures by lowering the rate to 0% in an effort to encourage lending which would lead to reduced unemployment rates and jumpstart the economy. With the unemployment rate now at pre-recession lows, the Fed is less concerned about rising unemployment but rather the prospect of over-heated markets with high inflation. To counter that possibility the Fed has begun the process of raising short-term interest rates.  This policy works well within the confines of textbooks, but may not offer the exact remedy that economists predict. Issues can arise if the higher rates temper investment and the improved employment market reverses. It also raises the probability of a so-called “inverted yield curve” whereby the interest rates on the shortest term bonds (think of a savings account interest rate) equal or exceed those of the longest-term bonds with maturities of 30-years. In this rare phenomenon, investors are paid more to hold an investment with less risk. Along with breaking the traditional risk-to-reward trade, an inverted curve has been a precursor to recession 7 times since 1970.

Politics

With less than a week to go in 2017, the biggest change to taxation law in the United States since 1986 was passed in a hasty fashion in order to cap off President Trump’s first year in office. The bill was passed without any Democratic votes and Republicans promoted the bill as a tax cut to the middle class. In reality the meat of the bill deals with changes to the corporate tax code (that was viewed favorably from both parties) and includes only modest tax cuts to a vast majority of taxpayers. At the same time it is projected to add over $1 trillion to the federal deficit over the next 10 years. Despite many positive aspects, the lack of both input by the minority party and true reform to the tax code paints a dim picture of the current state of governance during the Trump Administration. While the markets have largely avoided the “noise” of the political environment as investors bask in the positive benefits corporations will enjoy from tax reform, there are fewer legislative levers left that can be pulled to benefit businesses. This all leads to the all-important mid-term elections this November which could prove to be a referendum on the Trump presidency.

Glossary

Growth – Stocks that are growing sales and earnings at a higher pace than other stocks. Investors are typically willing to pay a higher price for growth stocks, leaving them susceptible to sudden drops.

Value – Stocks that are cheaper on a per-share amount of sales or earnings. In many instances value stocks are former growth stocks that have reached maturity without a catalyst for future growth.

Federal Funds RateInterest rate used by the largest banks to lend money in the shortest time periods, usually overnight.

† Indices used to represent asset classes:
U.S. Large Cap Stocks – S&P 500
U.S. Small Cap Stocks – Russell 2000
International Stocks – MSCI ACWI ex-U.S.
U.S. Bonds – Barclays Aggregate
Commodities – Bloomberg Commodity

IMPORTANT INFORMATION

The information presented here is not specific to any individual’s personal circumstances.

To the extent that this material concerns tax matters, it is not intended or written to be used, and cannot be used, by a taxpayer for the purpose of avoiding penalties that may be imposed by law. Each taxpayer should seek independent advice from a tax professional based on his or her individual circumstances.

These materials are provided for general information and educational purposes and represents Wilson Capital’s views based upon publicly available information from sources believed to be reliable—we cannot assure the accuracy or completeness of these materials. The information in these materials may change at any time and without notice.

Wilson Capital is a Registered Investment Advisor (“RIA”), registered in the state of Massachusetts. Wilson Capital provides asset management and related services for clients nationally. Wilson Capital will file and maintain all applicable licenses as required by the state securities boards and/or the Securities and Exchange Commission (“SEC”), as applicable. Wilson Capital renders individualized responses to persons in a particular state only after complying with the state’s regulatory requirements, or pursuant to an applicable state exemption or exclusion.

Click here to download a printable PDF 4Q17-Investment-Letter.pdf (425 downloads)


3Q17 Investment Letter

We feel investors should have an information outlet for the financial markets that is thorough, but does not require a prerequisite degree in economics. We hope this makes our commentary informative and educational for all levels of investors. We have also included a glossary at the end of this commentary that defines terms marked with an asterisk (*).

Quarter in Review

Asset Class† 3rd Quarter 2017 Return Past 12 Months
International Stocks 6.2% 19.6%
U.S. Small Cap Stocks 5.7% 20.7%
U.S. Large Cap Stocks 4.5% 18.6%
Commodities 2.5% -0.3%
U.S. Bonds 0.9% 0.1%

In terms of market performance, this quarter was almost an exact repeat of the previous quarter; steady positive gains in the stock markets along with record low volatility. The only slight difference is that the 3rd quarter had higher returns and lower volatility. Not since 1972 have there been fewer trading days (8) where the S&P 500 moved + or – 1% since the start of the year; an indicator that investors remain confident with current economic conditions.

The market environment continues to show positive signs, as corporate profits for companies in the S&P 500 grew for a 5th straight quarter to the highest levels on record. This comes despite little progress from Congress or the White House on delivering on the tax reform promised during the 2016 campaigns. On the economic front, the Federal Reserve has made a series of increases to their target interest rate since the end of 2015 in response to record low unemployment and rising inflation. While unemployment has continued to decline in 2017, inflation has been more tempered. In turn, current forecasts predict fewer rate changes through the end of 2018.

Richard Thaler and Behavioral Economics

In the first week of October, the Nobel Prize in Economics was awarded to Richard Thaler. Readers may remember Thaler for his cameo role in the movie “The Big Short” as the economist who explains the mortgage crisis using a blackjack game with Selena Gomez. While that role likely garnered him more visibility than winning the Nobel Prize, The Academy officially awarded the Prize for:

Incorporat[ing] psychologically realistic assumptions into analyses of economic decision-making. By exploring the consequences of limited rationalitysocial preferences, and lack of self-control, he has shown how these human traits systematically affect individual decisions as well as market outcomes.

This, in short, is the description of Thaler’s field of Behavioral Economics, which looks beyond the hard numbers typically associated with economics and adds a human decision-making element more often associated with the social sciences. Traditional economic thought relies on the rational choice theory where individuals always act in their best economic interest. Anyone that has ever made a frivolous purchase in the past knows this isn’t always the case, but it is only recently that Thaler’s human decision driven Behavioral Economic perspective has become more accepted in relation to the larger economy.

In many ways the current market conditions break the mold of history and academic research. In the period around the financial crisis, central banks (like the U.S. Federal Reserve) relied on monetary policy* to be the prescription to heal a significantly weakened economy where unemployment soared and consumer spending shrank. While unemployment rates have dropped dramatically, the expected rise in inflation has not followed as rapidly as textbook economics would predict. This is the monetary economists’ version of 1 + 1 = 3. A variety of explanations have been proposed, but ultimately this era has stretched the bounds of traditional economic reason.

With some areas of the economy displaying abnormalities that contradict traditional economic thought, it is even more reason to reflect on Thaler’s research and how human behaviors may be impacting recent trends. This is especially true considering that we are currently living through one of the most prolific bull markets on record. With few data-driven market indicators flashing warning signs and companies around the world reporting improving earnings, there is little reason to believe the bull market is nearing an end. However, if history is any indicator, bull markets often do not merely fizzle, and all data originates with personal decisions that can eventually drive a change in economic results without an explained reason. As the market strolls down the current euphoric path, watching for behavioral changes may be the first sign of a significant change of course.

Glossary

Monetary Policy–Economic theory mainly associated with economist Milton Friedman, that centers around central banks, like the U.S. Federal Reserve, using their power to manipulate interest rates in order to achieve a desired set of results such as full employment or low inflation.

Bull Market–Centuries old term (along with Bear Market) used to describe positive (Bull) or negative (Bear) market sentiments. The origins are disputed, but the term may be due to bulls lifting their horns upward to attack, while a bear swats its paws downward.

† Indices used to represent asset classes:
U.S. Large Cap Stocks – S&P 500
U.S. Small Cap Stocks – Russell 2000
International Stocks – MSCI ACWI ex-U.S.
U.S. Bonds – Barclays Aggregate
Commodities – Bloomberg Commodity

IMPORTANT INFORMATION

The information presented here is not specific to any individual’s personal circumstances.

To the extent that this material concerns tax matters, it is not intended or written to be used, and cannot be used, by a taxpayer for the purpose of avoiding penalties that may be imposed by law. Each taxpayer should seek independent advice from a tax professional based on his or her individual circumstances.

These materials are provided for general information and educational purposes and represents Wilson Capital’s views based upon publicly available information from sources believed to be reliable—we cannot assure the accuracy or completeness of these materials. The information in these materials may change at any time and without notice.

Wilson Capital is a Registered Investment Advisor (“RIA”), registered in the state of Massachusetts. Wilson Capital provides asset management and related services for clients nationally. Wilson Capital will file and maintain all applicable licenses as required by the state securities boards and/or the Securities and Exchange Commission (“SEC”), as applicable. Wilson Capital renders individualized responses to persons in a particular state only after complying with the state’s regulatory requirements, or pursuant to an applicable state exemption or exclusion.

Click here to download a printable PDF 3Q17-Investment-Letter-FINAL.pdf (423 downloads)


2Q17 Investment Letter

We feel investors should have an information outlet for the financial markets that is thorough, but does not require a prerequisite degree in economics. We hope this makes our commentary informative and educational for all levels of investors. We have also included a glossary at the end of this commentary that defines terms marked with an asterisk (*).

Quarter in Review

Asset Class† 2nd Quarter 2017 Return Past 12 Months
International Stocks 5.8% 19.1%
U.S. Small Cap Stocks 3.5% 24.6%
U.S. Large Cap Stocks 3.1% 17.9%
U.S. Bonds 1.5% -0.3%
Commodities -3.0% -6.5%

With stock market volatility at record lows, the second quarter of 2017 was rather unexciting, but resulted in a continuation of steady positive returns for stocks around the world along with modest gains for bonds. When strung together, the returns for stocks in the previous 12 months remain eye-popping with double-digit gains across the board. To put the lack of volatility in perspective, for the first 2 quarters of the year there have only been 4 trading days where the return was greater than 1% or less than -1% for the S&P 500, something that hasn’t occurred in consecutive quarters in more than 20 years.

A continuous rise in equity markets with low volatility for an extended period can lull investors into a false sense of security. On the positive side, company earnings, which had slid from late 2014 into early 2016, have rebounded faster than expected and have outpaced the gains in the market itself. This means that for the broad market, company valuations are less lofty than they were a few years ago despite better returns. While bond yields remain low, encouraging investment by both companies and consumers, central banks around the world still remain on a path to raising interest rates which tend run counter to companies profit growth.

The already red-hot technology sector was further emboldened with the announcement that Amazon (Ticker: AMZN) was purchasing Whole Foods Markets (more below). The purchase put a scare in the retail sector as fresh food and grocery stores have been viewed as an area that internet merchandizing could never fully disrupt.

Outlook

As mentioned earlier, the biggest investing news of the quarter was perhaps Amazon’s announced purchase of Whole Foods Market. The move certainly helps the online retail giant increase their footprint to their target demographic of urban upper-class consumers, however it does not necessarily broaden its consumer base. This indicates that Amazon’s path to capture more sales will be paved by a superior logistics and distributing operation. This route may prove successful, but will likely be challenged on a number of fronts including profitability, consumer purchasing habits, and monopoly.

A large reason how Amazon has been growing their total sales is by offering everything a consumer needs at the lowest price delivered in two days or less–something that most retailers lack the logistics to provide and that erodes profit margins–in the hopes of capturing even more customers. This model works until growth shows signs of decline and investors become weary of an inflated stock price. While Amazons’ sales growth is indeed much stronger than competitors like Target, Wal-Mart, or Best Buy, their profitability is a fraction of those competitors. That can continue on this path so long as they keep gaining customers, but that scenario also has its limits.

For the past 12 months as of March 2017, Amazon sold $100 Billion in goods in the US, while the total U.S. consumer bought $4.2 trillion in goods. This is impressive market share especially considering that Amazon focuses almost entirely on the so-called non-durables* products. That segment however, has been growing at a half the pace of the durables segment in the past 5 years. In order to continue their growth, Amazon will need to see changes in the way American’s consume products or find ways to gain market share of the durables or services markets. Amazon has made entries in various service areas such as video and cloud computer storage, but those areas have few synergies to package delivery. Similarly, the durables segment by nature requires logistics beyond boxing and mailing, though the day may come when a washing machine is delivered to your door via a powerful Amazon drone†.

Corporate monopolies are largely a historic relic from the days of the Rockefellers of Standard Oil and the Vanderbilts of railways, but the U.S. government still looks unfavorably on companies that take a market share large enough to reduce consumer choice. Acquisitions like Whole Foods do not necessarily eliminate a competitor (a significant hurdle when assessing a monopoly) or directly reduce consumer choice, but they further Amazon’s reach into a new business line where it can undercut and possibly force out competitors. Once Amazon has eliminated enough competitors and gained captive customers, below market prices aren’t needed and the customer ends up paying higher prices with fewer options. Which is precisely the government’s concern when assessing monopolistic enterprises.

With many retail options still available, this scenario is not yet on the horizon, but will be as Amazon continues to gain market share and traditional brick and mortar retailers struggle. How Amazon manages investor expectations while continuing to offer a value proposition for the consumer will be an important question moving forward.

†At the end of the previous week Amazon announced a partnership with Sears to include Kenmore appliances on the Amazon website. The deal stipulates than Sears will warehouse, deliver and install the appliances.

Glossary

Consumer Non-Durables – goods that are purchased frequently and regularly. Examples include food, gas and clothing

Consumer Durables – goods that have an extended useful life and are typically purchased on a cycle rather than continuously. Examples are appliances and cars

† Indices used to represent asset classes:
U.S. Large Cap Stocks – S&P 500
U.S. Small Cap Stocks – Russell 2000
International Stocks – MSCI ACWI ex-U.S.
U.S. Bonds – Barclays Aggregate
Commodities – Bloomberg Commodity

IMPORTANT INFORMATION

The information presented here is not specific to any individual’s personal circumstances.

To the extent that this material concerns tax matters, it is not intended or written to be used, and cannot be used, by a taxpayer for the purpose of avoiding penalties that may be imposed by law. Each taxpayer should seek independent advice from a tax professional based on his or her individual circumstances.

These materials are provided for general information and educational purposes and represents Wilson Capital’s views based upon publicly available information from sources believed to be reliable—we cannot assure the accuracy or completeness of these materials. The information in these materials may change at any time and without notice.

Wilson Capital is a Registered Investment Advisor (“RIA”), registered in the state of Massachusetts. Wilson Capital provides asset management and related services for clients nationally. Wilson Capital will file and maintain all applicable licenses as required by the state securities boards and/or the Securities and Exchange Commission (“SEC”), as applicable. Wilson Capital renders individualized responses to persons in a particular state only after complying with the state’s regulatory requirements, or pursuant to an applicable state exemption or exclusion.

Click here to download a printable PDF 2Q17-Investment-Letter-Final-72417.pdf (427 downloads)


1Q17 Investment Letter

We feel investors should have an information outlet for the financial markets that is thorough, but does not require a prerequisite degree in economics. We hope this makes our commentary informative and educational for all levels of investors. We have also included a glossary at the end of this commentary that defines terms marked with an asterisk (*).

Quarter in Review

Asset Class† 1st Quarter 2017 Return Past 12 Months
International Stocks 7.9% 13.1%
U.S. Large Cap Stocks 6.1% 17.2%
U.S. Small Cap Stocks 2.5% 26.2%
U.S. Bonds 0.8% 0.4%
Commodities -2.3% 8.7%

The 1st quarter of 2017 continued the stretch of positive returns for stock markets both domestic and abroad, while bond returns remained subdued amid expectations of higher interest rates. In general, events directly related to the stock and bond markets were largely absent during this quarter, which may be due in part to the public adjusting to the era of the Trump Presidency. On that front there was no shortage of daily fodder, but perhaps less upheaval related to the markets than was expected in the post-election period.

Botched rollouts of immigration and health care policy reform by the new administration were among the most notable events of the quarter. These, along with a slew of contentious White House cabinet appointments and a heated Senate battle over Supreme Court nominee Neil Gorsuch, stole the spotlight from most market events. Tax reform, which has bi-partisan support and was discussed at length in the previous quarter’s letter, remained on the back-burner where it may stay until cooler heads prevail both within the White House and in the halls of Congress.

Among the biggest market-related events, disappearing-message company Snap (ticker symbol: SNAP) went public during the quarter, hitting a market valuation of $34 Billion in its first day of trading, despite its founders admitting that the company may never turn a profit. In other headlines, the market value of electric carmaker Tesla (ticker symbol: TSLA) surpassed Ford (ticker symbol: F) despite being outsold on vehicles 52 to 1. These are just two examples of the exuberance on Wall Street for companies that sell dreams rather than realities.

Outlook

Where the economy and the markets will head next is the eternal question du jour with anyone associated with investments. As this letter has discussed in quarters’ past, under many circumstances there is a prevailing sentiment or mindset that permeates through the industry. The sentiment now seems decidedly unsettled and divided.

The bull* can point to continually low unemployment numbers, a low-enough interest rate environment that still encourages lending, and a pro-business President Trump that has shown to be less volatile than expected. The bear* sees a labor market where many people are still stuck on part-time jobs, a rising interest rate/inflation environment that could snarl growth, and a President with no political experience who recently discovered that foreign military intervention could help his approval ratings. Neither camp is wrong—the two perspectives reflect different views of the same current market landscape and where it might head next.

While this division is not a “normal” position for the market, it isn’t at all unprecedented and as recent history has shown it can lead to varying results. The period of 2005-2007 had been a relatively positive time for the financial markets. During that period a wide swath of pros saw a picture of increased wealth for all Americans with few predicting an all-out collapse of the mortgage and banking industries. Today, we know that divided view on the world quickly coalesced once the storm clouds developed in the spring of 2008 that led to the autumn market crash. On the flip side, during the summer of 2011 some investors predicted certain doom as congress refused to raise the debt ceiling*, which many believed would de-rail the rapid recovery since 2008 and put the U.S. financial system in a death spiral. In that case, the vocal group’s fears were unfounded as the government never fully shut down and despite a 6-month correction in the 2nd half of 2011, the U.S. markets have spring-boarded higher.

While it is always helpful to look at history for context, the next big move in the market could very well come from events that begin far from Wall Street. Bi-partisan tax or health care reform could yield a positive market response, while a more aggressive foreign policy platform could be disruptive to markets. At this point however, there is no way to accurately handicap those or any of a handful of possible market moving externalities.

Glossary

Debt Ceiling – The Constitutional limit of borrowing allowed by the U.S. Treasury and is approved by the Congress.  This borrowing, or debt, pays for everything ranging from government salaries to social security benefits. The ceiling has been raised as a regular course of business many times, but in recent decades it has come under more scrutiny under a ballooning federal budget.

Bulls and Bears – Centuries old terms used to describe positive (Bull) or negative (Bear) market sentiments. The origins are disputed, but the term may be due to bulls lifting their horns upward to attack, while a bear swats its paws downward.

† Indices used to represent asset classes:
U.S. Large Cap Stocks – S&P 500
U.S. Small Cap Stocks – Russell 2000
International Stocks – MSCI ACWI ex-U.S.
U.S. Bonds – Barclays Aggregate
Commodities – Bloomberg Commodity

IMPORTANT INFORMATION

The information presented here is not specific to any individual’s personal circumstances.

To the extent that this material concerns tax matters, it is not intended or written to be used, and cannot be used, by a taxpayer for the purpose of avoiding penalties that may be imposed by law. Each taxpayer should seek independent advice from a tax professional based on his or her individual circumstances.

These materials are provided for general information and educational purposes and represents Wilson Capital’s views based upon publicly available information from sources believed to be reliable—we cannot assure the accuracy or completeness of these materials. The information in these materials may change at any time and without notice.

Wilson Capital is a Registered Investment Advisor (“RIA”), registered in the state of Massachusetts. Wilson Capital provides asset management and related services for clients nationally. Wilson Capital will file and maintain all applicable licenses as required by the state securities boards and/or the Securities and Exchange Commission (“SEC”), as applicable. Wilson Capital renders individualized responses to persons in a particular state only after complying with the state’s regulatory requirements, or pursuant to an applicable state exemption or exclusion.

Click here to download a printable PDF: 1Q17-Investment-Letter-42317.pdf (539 downloads)


4Q16 Investment Letter

We feel investors should have an information outlet for the financial markets that is thorough, but does not require a prerequisite degree in economics. We hope this makes our commentary informative and educational for all levels of investors. We have also included a glossary at the end of this commentary that defines terms marked with an asterisk (*).

Quarter & Year in Review

Asset Class† 4th Quarter 2016 Return Full Year 2016 Return
U.S. Small Cap Stocks 8.8% 21.3%
U.S. Large Cap Stocks 3.8% 12.0%
Commodities 2.7% 11.8%
International Stocks -1.3% 4.5%
U.S. Bonds -3.0% 2.7%

In terms of 2016 market performance, one could say as went the 4th quarter, so went the year. And what a quarter and year they were for U.S. equities. Both large and small company stocks turned in double-digit returns through the year for the first time since 2013, while the bond market lagged behind most stock indexes. The Barclays Aggregate bond index was especially hard hit in the 4th quarter, returning -3%, the worst one-quarter return since the 3rd quarter of 1981.

The stunning upset victory of Donald Trump for U.S. President was the dominant event of the quarter. The market reaction of the election was both significant and largely unexpected. Polls swayed in the direction of a Clinton victory in the weeks leading up to the election with a lack of significant movement in market returns. This indicated a larger level of comfort in a Clinton presidency as many pundits viewed her as a known entity with her presidency predicted to be largely a continuation of Obama’s policies.

This all changed as the results started to roll in on election night and the market started grappling with a Trump Presidency. Though the U.S. stock market was closed, a violent drop in Dow Jones futures contracts* to a low of 758 points seemed to confirm the sentiment leading up to the election and a foreshadowing days of market volatility ahead.

However, in near lockstep with the Brexit reaction from the summer, the initial shock of the election reversed as the markets opened Wednesday morning, starting a mini bull market that continued uninterrupted through the end of December with the Dow Jones gaining over 1,500 points. The boom was especially evident in the financial sector as the Trump agenda indicates easing of regulations enacted after the 2008 financial crisis.

Spotlight: Trump Tax Outlook

As we near inauguration day and the Trump cabinet and policies take form, it appears as though the Trump presidency will be in significant contrast to that of his predecessor. While Trump’s bombastic style and off-the cuff tweets about wall building and eliminating ObamaCare have garnered much of the media attention, some of his most developed plans relate to the economy and tax code. Trump has vowed to make sweeping changes to the personal and corporate tax rates, both of which deserve a closer examination and look at their impact.

Personal Taxes

Trump has indicated the desire to reduce taxes in a plan that would include lower overall rates, increases to the standard deduction, limits to the use of itemized deductions, and elimination of the estate or “death” tax. Below is a chart outlining some of the key proposed changes.

Current Law Trump Proposal Beneficiaries of Proposed Changes
7 tax brackets Reduce the number of tax brackets to 3 All taxpayers would pay lower rates, but outsized benefit to those in the highest tax brackets
39.6% highest marginal tax rate Lower the highest marginal tax rate to 33%
Standard deduction is $6,300 Increase the standard deduction to $15,000 Low-middle income taxpayers, especially those without a mortgage
$4,050 exemption per dependent Eliminate personal exemption Single taxpayers
No limit to itemized deductions Limit itemized deductions to $100,000 U.S. government
No law on childcare deduction (personal exemption is similar) Childcare tax deduction for children under 13 Families with young children, especially those in the lowest income brackets
40% tax on estates greater than $5.45 million Eliminate the Estate Tax Wealthiest and also families with farms and private businesses

*All dollar amounts pertain to single taxpayers

This plan, as outlined above, offers benefits for a wide swath of the taxpaying public. The wealthy will certainly benefit a great amount from this plan, but changes to the standard deduction and the addition of a childcare deduction would have significant impact to many middle-income Americans.

Corporate Taxes

Trump has also made promises to lower the corporate income tax and create policies that will make it easier to repatriate foreign corporate profits* back to the United States. Currently, the corporate tax rate in the US is 35%–making it the highest rate among all industrialized nations. This rate has led to many companies implementing the dreaded “financial engineering”* that became commonplace during the Obama administration. Moving forward, the Trump administration hopes to find a rate high enough to keep overall corporate tax revenues steady, while being low enough that companies will no longer look to engineering ways to avoid paying large portions of their total tax bill to the U.S. government. Trump has discussed cutting to a 15% rate that would put the U.S. at the extreme low end of the world corporate tax spectrum (only Ireland is lower at 12.5%). Such an extreme may not be needed to be competitive, as even a rate in the mid-low 20% would put the U.S. in the lowest handful of developed market corporate tax rates.

Takeaways

In all, this plan is very ambitious with many tax cuts and few new areas of revenue. One analysis done by the non-profit Tax Foundation shows the U.S. would face a $5.9 trillion deficit in the 10 years following implementation of Trump’s plan. Trump himself acknowledges a shortfall when evaluating this plan with current economic growth rates, but insists that a dynamic measure that accounts for increases in GDP growth and productivity narrows, or even closes, that shortfall. This will surely be a point of contention as Trump takes office and something that we’ll be sure to revisit in this letter as we begin to see the plan and its impact take shape.

Additional Information on Trump’s tax plan:

https://www.donaldjtrump.com/policies/tax-plan/

http://taxfoundation.org/article/details-and-analysis-donald-trump-tax-reform-plan-september-2016

Glossary

Futures Market – Financial market where investors can buy and sell contracts that bet on the future price of an underlying investment. Index futures are widely publicized during non-market hours as an indication of how the markets will perform when trading resumes.

Standard Deduction – Set amount of money that is subtracted from annual income reducing the amount of tax owed to the IRS. Differs from itemized deductions where taxpayers list items such as mortgage interest and charitable contributions. Itemized deductions are used if the total amount of items is larger than the standard deduction.

Personal Exemption – Similar to the standard deduction, it is a set amount of income not taxed based upon the number of people in a household. Unlike the standard deduction, it is available to those who choose to itemize their deductions.

Repatriation of Foreign Profits – Under current tax law, companies only pay U.S. income tax when profits are made in the U.S. or profits made outside the U.S. are brought back to the U.S. Many companies avoid paying U.S. taxes by keeping foreign profits overseas. A lower tax rate may encourage companies to repatriate or bring that money to the U.S.

Financial Engineering – Use debt and profits by companies to purchase their own stock back. This increases the amount of profit per share owned. Alternatively a company could use those same profits on research and development or capital improvements.

† Indices used to represent asset classes:
U.S. Large Cap Stocks – S&P 500
U.S. Small Cap Stocks – Russell 2000
International Stocks – MSCI ACWI ex-U.S.
U.S. Bonds – Barclays Aggregate
Commodities – Bloomberg Commodity


IMPORTANT INFORMATION

The information presented here is not specific to any individual’s personal circumstances.

To the extent that this material concerns tax matters, it is not intended or written to be used, and cannot be used, by a taxpayer for the purpose of avoiding penalties that may be imposed by law. Each taxpayer should seek independent advice from a tax professional based on his or her individual circumstances.

These materials are provided for general information and educational purposes and represents Wilson Capital’s views based upon publicly available information from sources believed to be reliable—we cannot assure the accuracy or completeness of these materials. The information in these materials may change at any time and without notice.

Wilson Capital is a Registered Investment Advisor (“RIA”), registered in the state of Massachusetts. Wilson Capital provides asset management and related services for clients nationally. Wilson Capital will file and maintain all applicable licenses as required by the state securities boards and/or the Securities and Exchange Commission (“SEC”), as applicable. Wilson Capital renders individualized responses to persons in a particular state only after complying with the state’s regulatory requirements, or pursuant to an applicable state exemption or exclusion.

Click here to download a printable PDF: 4Q16-Investment-Letter-Final-11817.pdf (611 downloads)


3Q16 Investment Letter

We feel investors should have an information outlet for the financial markets that is thorough, but does not require a prerequisite degree in economics. We hope this makes our commentary informative and educational for all levels of investors. We have also included a glossary at the end of this commentary that defines terms marked with an asterisk (*). 

Quarter in Review

Off the heels of the market-rocking U.K. Brexit vote at the end of June and an approaching U.S. presidential election, the third quarter started under a cloud of uncertainty. However, despite these lingering issues and the almost robotic nature of volatile markets in recent quarters, the 3rd quarter was one of the most placid in history. After the initial shock of the Brexit vote, stock markets across the globe rose steadily. With only two trading days where the S&P 500 fell more than 1% (lowest number since 3Q 2013), it seems as though many investors took their late summer vacations.

Asset Class† 3rd Quarter 2016 Return
U.S. Small Cap Stocks 9.1%
International Stocks 6.9%
U.S. Large Cap Stocks 3.9%
U.S. Bonds 0.5%
Commodities -3.9%

The quarter featured little movement in the key data that drives Federal Reserve policy, as the latest September unemployment number remains steady around 5.0% and inflation is hovering near the 1% mark. With the unemployment rate around the lowest levels since before the 2008 financial crisis and steady positive inflation, expectations of an interest rate hike have been on the rise. However, six consecutive quarters of decline in S&P 500 company earnings and issues of global economic growth have reduced the probability of any significant moves in the coming quarters.

In the Headlines: Wells Fargo

Among the more newsworthy events of the quarter was the announcement from Wells Fargo that the bank had opened over 2.1 million unauthorized accounts for their customers. The culprit was a sales culture that incentivized employees to cross-sell a wide swath of services to their clients regardless of their needs, or in these cases even their knowledge. The unauthorized account openings did little to add to the company’s financial coffers, but the motivation by executives was not to directly increase the revenue or profitability of the firm, but rather to show appearances that their sales culture was superior to other banks which might result in riches down the road. Non-financial metrics such as “daily active users” or “mobile engagement” have become the norm when discussing social media companies, so perhaps it comes as no surprise that other companies would attempt to create their own new metrics to impress Wall Street stock analysts.

Commentary: Decline in CAPEX Spending

With a quarter of steady returns across the board, one could easily assume it was dominated by positive news and optimism about future prospects. However, as has been noted in this space in earlier quarters, the market tends to perform best under steady conditions, not necessarily with good news.

A troubling trend has been the reluctance of companies to spend earnings on capital expenditures. Capital expenditures, or CAPEX, are monies outlaid by companies to purchase physical assets like machinery or buildings, with an eye towards investing in the long-term profitability of the company. Such expenses usually have little or no immediate impact on profits and often require debt financing. With interest rates at record low levels, companies should be encouraged to increase debt loads in order to finance CAPEX projects. While debt levels have increased, the cash raised has had virtually no affect on companies’ capital spending. Instead, more companies are choosing to repurchase shares as a way of increasing earnings per share*. The ubiquitous use of these buy-backs, often labeled “financial engineering”, has been well chronicled by the finance media and was discussed in this column (April 2015).

The table below highlights the declines in both CAPEX and the number of shares outstanding for the non-financial companies in the Dow Jones Industrial Average (A list of companies is included in the glossary).

Average Year-over-year changes as of 2Q:

2013-2016 2005-2013
CAPEX -0.6% 11.1%
Shares Outstanding -2.2% -1.4%

Normally, capital expenditures have a significant positive affect on the economy. Dollars spent on CAPEX flow down through the economy to the construction, manufacturing, and building industries and eventually to the pockets of workers who are more likely to spend an extra dollar, sparking further consumer demand. On the other hand, money spent repurchasing shares has few direct beneficiaries other than shareholders, who tend to be wealthier and more wiling to save, rather than spend an extra dollar.

There is no telling how long a reduction in capital spending can continue, but along with the historic trends across the globe towards service oriented economies, a significant change in course appears unlikely. The question is whether this combination can persist without having lasting affects on wealth disparity, growth, and employment across world economies.

Glossary

Brexit – Formally the United Kingdom European Union referendum, was a vote in June 2016 by U.K. voters to leave the European Union which affects trade and banking agreements between in U.K. and 27 other European countries.

Earnings-Per-Share – The amount of earnings or profit that a company makes allocated for each share that is outstanding in the market for that period.

Dow Jones Industrial Average – One of the earliest stock market indexes, which tracks a small basket of stocks in order to measure performance of a broader stock market. Though the word “industrial” is in the name, the index tracks companies from all economic sectors.

Non-Financial Dow Jones Industrial Companies – 3M, Apple, Boeing, Caterpillar, Chevron, Cisco, Coca-Cola, DuPont, ExxonMobil, GE, Home Depot, IBM, Intel, Johnson & Johnson, McDonalds, Merck, Nike, Pfizer, Procter & Gamble, UnitedHealthCare, United Technologies, Verizon, Wal-Mart, Walt Disney

† Indices used to represent asset classes:
U.S. Large Cap Stocks – S&P 500
U.S. Small Cap Stocks – Russell 2000
International Stocks – MSCI ACWI ex-U.S.
U.S. Bonds – Barclays Aggregate
Commodities – Bloomberg Commodity

IMPORTANT INFORMATION

The information presented here is not specific to any individual’s personal circumstances.

To the extent that this material concerns tax matters, it is not intended or written to be used, and cannot be used, by a taxpayer for the purpose of avoiding penalties that may be imposed by law. Each taxpayer should seek independent advice from a tax professional based on his or her individual circumstances.

These materials are provided for general information and educational purposes and represents Wilson Capital’s views based upon publicly available information from sources believed to be reliable—we cannot assure the accuracy or completeness of these materials. The information in these materials may change at any time and without notice.

Wilson Capital is a Registered Investment Advisor (“RIA”), registered in the state of Massachusetts. Wilson Capital provides asset management and related services for clients nationally. Wilson Capital will file and maintain all applicable licenses as required by the state securities boards and/or the Securities and Exchange Commission (“SEC”), as applicable. Wilson Capital renders individualized responses to persons in a particular state only after complying with the state’s regulatory requirements, or pursuant to an applicable state exemption or exclusion.

Click here to download a printable PDF: 3Q16-Investment-Letter-FINAL-for-web.pdf (541 downloads)


2Q16 Investment Letter

We feel investors should have an information outlet for the financial markets that is thorough, but does not require a prerequisite degree in economics. We hope this makes our commentary informative and educational for all levels of investors. We have also included a glossary at the end of this commentary that defines terms marked with an asterisk (*). 

Quarterly Spotlight: Brexit Vote and Impact

Like many of the quarters in the recent past, a single event defined the 2nd quarter of 2016: the United Kingdom’s referendum vote to leave the European Union in late June (colloquially know as “Brexit”). Prior to the Brexit vote, markets had been in a fairly docile state as company earnings from the 1st quarter had, on average, matched the analyst expectations and the price of oil ascended to and steadied around the $50 per barrel mark. The rise in oil prices played a significant role in the strong performance of commodities, while the continuation of depressed interest rates resulted in another quarter of positive bond returns (bond prices move inversely to interest rates.)

Asset Class† 2nd Quarter 2016 Return
Commodities 12.8%
U.S. Small Cap Stocks 3.8%
U.S. Large Cap Stocks 2.5%
U.S. Bonds 2.2%
International Stocks -0.6%

The “leave” vote by a majority of Britons wreaked havoc on nearly all equity markets including the U.S. where the S&P 500 lost nearly 6% in a 2-day period, only to regain all that was lost in the week ending the quarter. The reason for such a sharp decline followed by an almost equally sharp rebound likely had more to do with the unexpectedness of the result, rather than the result itself. All major polling leading up to the vote had pointed to the “remain” camp winning, and as often happens when unexpected news hits, markets reacted in a violent manner.

That is not so say that the result of the U.K. leaving the EU does not have repercussions, but rather it may take some time to determine exactly how the process of leaving the EU pans out. Since this is an unprecedented event, it is largely unknown how issues relating to finance such as trade agreements and currency movements will be resolved, but early indications are that the process will play out over a long time period.

Commentary: Emergence of Negative Interest Rates

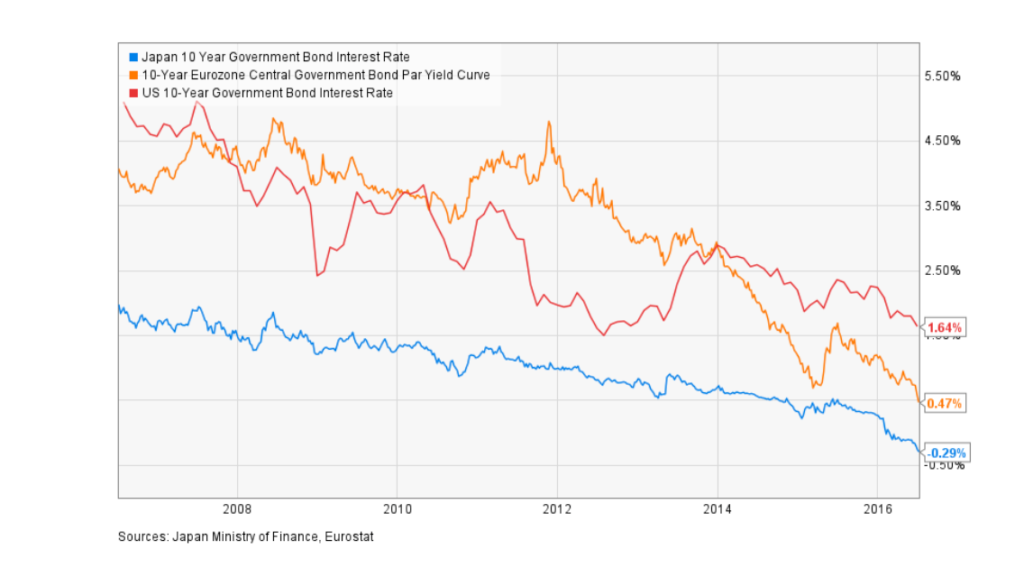
Since the end of the 2008 financial crisis, it has been well documented that interest rates across the globe have been on a downward trajectory. By utilizing Monetary policy* to affect interest rates, central banks have made borrowing money less expensive, which was intended to stimulate economies. However, something strange has recently occurred where some European and Japanese bonds are sporting negative interest rates. This phenomenon breaks even the most elementary principles of economics and banking–since savers are expected to earn interest and borrowers are expected to pay interest.

See the table below to see how this negative interest rate trend is impacting recent interest rate curves in Japan, Europe and the US.

IMG_8247
While the interest rate on government bonds does affect the rates at which individuals and businesses can borrow, we are still far away from negative rates creeping into everyday financial life (though you can always still dream of getting paid to have a mortgage). In the current context of economic thought, zero was always assumed to be the lowest point that interest rates could go. However, this downward trending environment is disproving this theory–which is bringing up the question of how we can prepare for the future within our current understanding of economics. Since the birth of economics as a social science, trends and eras of economic principle have evolved slowly as the world and cultures changed. In fact, these recent spreading beliefs of Monetarist economics are relatively new, only reaching the mainstream in the past half century. Right now this small slice of economic history is seeing a lot of change in a short amount of time. It is too early to tell if this is merely a blip in the history of economics or whether it may be the beginning of a longer new era, where new theories must be tested.

Glossary

Monetarist Economics/Monetary Policy – Economic theory mainly associated with economist Milton Friedman, that centers around central banks, like the U.S. Federal Reserve, using their power to manipulate interest rates in order to achieve a desired set of results such as full employment or low inflation.

† Indices used to represent asset classes:
U.S. Large Cap Stocks – S&P 500
U.S. Small Cap Stocks – Russell 2000
International Stocks – MSCI ACWI ex-U.S.
U.S. Bonds – Barclays Aggregate
Commodities – Bloomberg Commodity

IMPORTANT INFORMATION

The information presented here is not specific to any individual’s personal circumstances.

To the extent that this material concerns tax matters, it is not intended or written to be used, and cannot be used, by a taxpayer for the purpose of avoiding penalties that may be imposed by law. Each taxpayer should seek independent advice from a tax professional based on his or her individual circumstances.

These materials are provided for general information and educational purposes and represents Wilson Capital’s views based upon publicly available information from sources believed to be reliable—we cannot assure the accuracy or completeness of these materials. The information in these materials may change at any time and without notice.

Wilson Capital is a Registered Investment Advisor (“RIA”), registered in the state of Massachusetts. Wilson Capital provides asset management and related services for clients nationally. Wilson Capital will file and maintain all applicable licenses as required by the state securities boards and/or the Securities and Exchange Commission (“SEC”), as applicable. Wilson Capital renders individualized responses to persons in a particular state only after complying with the state’s regulatory requirements, or pursuant to an applicable state exemption or exclusion.

Click here to download a printable PDF of this letter: 2Q16-Investment-Letter-FINAL-72016.pdf (477 downloads)


1Q16 Investment Letter

As an investment advisory, we feel investors should have an information outlet for the financial markets that is thorough, but does not require a prerequisite degree in economics. We hope this makes our commentary informative and educational for all levels of investors. We have also included a glossary at the end of this commentary that defines terms marked with an asterisk (*).

Quarter in Review

For the casual market observers it may be hard to believe that most markets were relatively unchanged in the first quarter of 2016. A precipitous drop in the global equity markets in January, fueled by lower oil prices, was followed by steady increases from mid-February through March.

Asset Class† 1st Quarter 2016 Return
U.S. Bonds 3.0%
U.S. Large Cap Stocks 1.4%
Commodities 0.4%
International Stocks -0.4%
U.S. Small Cap Stocks -1.5%

While lately it seems as though volatility in the equity markets is commonplace, this quarter’s volatility was even outside of the “normal” range. The 1st quarter of 2016 had the largest intra-quarter swing in the S&P 500 since 4th quarter 2011, during what we now know was the early part of this 7-year-old bull market.

The usual suspects of lower oil prices, fear of rising interest rates, and concerns of global growth shouldered much of the blame for the move downward to start out the quarter. As oil continued to slide towards the oft-prognosticated bound of $30 a barrel, it seemed investors began imagining nuclear power and electric cars for the masses and it was only a matter of time until oil reached $0. As predicted, sanity kicked in right around $30 a barrel ($29.85 to be exact), and oil rebounded to settle the quarter around $40 a barrel.

The quarter saw strong showings from stocks in defensive sectors* like Utilities (up 15%) and Telecommunications (up 11%), along with a reversal of fortune for high-growth stocks like Amazon and Netflix, which were down 12% and 11% respectively. These results are not abnormal during times of high volatility and show a desire for safety in these turbulent times. Investors begin to hesitate to follow the latest trendy stock and return back to the basics.

Outlook

After such a volatile quarter in nearly all markets, it is apparent that the current environment is full of wide ranging opinions on the future. There are bright spots, such as continued improvements to the U.S. employment numbers, but those are countered by negative news like the continually lackluster foreign economic indicators.

Something that has made financial headlines in recent weeks and is likely to continue as we turn into the second quarter is the trend in companies issuing so-called “pro-forma” or headline earnings. U.S. companies are required to report their earnings according to a set of rules called Generally Accepted Accounting Principles (GAAP)*. Since GAAP is universal and its rules may not always fit with every situation, occasionally companies report a separate set of earnings that executives feel better match up to the reality of company operations—a pro forma earnings report. These pro forma earnings reports are typically issued after unusual and infrequent events, such as a natural disaster, that affect the bottom line.

Recently, there has been a bit more open interpretation of what constitutes unusual or infrequent. In 2015 several companies took some interesting liberties. Caterpillar, the heavy equipment manufacturer, adjusted its earnings by $600 million due to “restructuring” costs, despite having $300 million in such costs in 2014 and expecting $250 million again in 2016. The most ubiquitous and perhaps more concerning trend is the practice of removing any compensation paid in company stock* by many technology companies such as Facebook or Twitter. Facebook’s GAAP earnings for 2015 were $3.6 billion, but the pro-forma earnings which excludes stock-based compensation was $6.5 billion. This is interesting considering stock comprises a great deal of employee compensation and has been done each quarter since the IPO of the company. Unusual? Nope. Infrequent? Hardly!

How this affects investments depends on who you ask. The companies doing it feel as though they are giving investors and the analysts who track their stock a more “realistic” look at the company’s true business operations. In Caterpillar’s case, executives view the restructuring as only a phase and with Facebook the stock given to employees doesn’t directly affect their capital for day-to-day operations. The opposing view is that pro-forma earnings are imaginative at best and a lie at worst.

It is too early to tell whether pro-forma earnings will ever amount to more than creative accounting, but Warren Buffet once said, “you only find out who is swimming naked when the tide goes out”. If that’s the case, it may not be the best time to head to pro-forma beach.

Glossary

Defensive Stocks – These are stocks from companies that have non-cyclical lines of business that remain steady through most environments, but often do not have high growth prospects. Utilities and Telecommunications stocks fall into this category because electric power and telephone use are relatively steady even in economic downturns.

Stock-based Compensation – Method of rewarding employees by giving shares of company stock rather than cash. Used regularly by companies to pay executives since their performance is often tied to the stock price, it has now become a regular component of tech companies to pay all levels of employees.

† Indices used to represent asset classes:
U.S. Large Cap Stocks – S&P 500
U.S. Small Cap Stocks – Russell 2000
International Stocks – MSCI ACWI ex-U.S.
U.S. Bonds – Barclays Aggregate
Commodities – Bloomberg Commodity

IMPORTANT INFORMATION

The information presented here is not specific to any individual’s personal circumstances.

To the extent that this material concerns tax matters, it is not intended or written to be used, and cannot be used, by a taxpayer for the purpose of avoiding penalties that may be imposed by law. Each taxpayer should seek independent advice from a tax professional based on his or her individual circumstances.

These materials are provided for general information and educational purposes and represents Wilson Capital’s views based upon publicly available information from sources believed to be reliable—we cannot assure the accuracy or completeness of these materials. The information in these materials may change at any time and without notice.

Wilson Capital is a Registered Investment Advisor (“RIA”), registered in the state of Massachusetts. Wilson Capital provides asset management and related services for clients nationally. Wilson Capital will file and maintain all applicable licenses as required by the state securities boards and/or the Securities and Exchange Commission (“SEC”), as applicable. Wilson Capital renders individualized responses to persons in a particular state only after complying with the state’s regulatory requirements, or pursuant to an applicable state exemption or exclusion.

Click here to download the PDF of the Investment Letter: 1Q16-Investment-Letter-Final-041416.pdf (636 downloads)


4Q15 Investment Letter

As an investment advisor, we feel investors should have an information outlet for the financial markets that is thorough, but does not require a prerequisite degree in economics. We hope this makes our commentary informative and educational for all levels of investors. We have also included a glossary at the end of this commentary that defines terms marked with an asterisk (*).

Year in Review

Just like the year before it, 2015 closed with generally subdued results across the board. Large U.S. stocks led the way for the second year in a row, with help from Internet-based heavyweights Amazon and Google, although gains were modest. Bonds barely squeaked out a gain, marking their second-worst year in the last decade, as investors grappled with the prospect of rising interest rates. The commodities market, which includes oil, gold, and grains, posted its 5th straight year of negative returns, continuing its stunning streak in futility.

Asset Class† 2015 Annual Return
U.S. Large Cap Stocks 1.4%
U.S. Bonds 0.6%
U.S. Small Cap Stocks -4.4%
International Stocks -5.7%
Commodities -24.7%


Quarter in Review

The Federal Reserve’s December announcement that it raised the Federal Funds Rate* to 0.25% marked a momentous shift in monetary policy, ending years of zero interest rates. Although rising interest rates can be a sign of a rebounding economy, they also raise concerns that it will become more expensive to borrow money. Despite years of hype surrounding the appropriate timing and adverse market reaction to the first change in interest rate policy in nearly seven years, the market’s reaction to this event was a collective yawn. Short-term lending rates rose, but long-term lending rates used for most consumer financing such as mortgages barely nudged on the news.

Oil continued its decline, falling another 20% during the quarter to trade at about $30 per barrel, its lowest levels in over a decade. The influx in supply from U.S. shale “fracking” and unrelenting production by the OPEC* cartel—designed to keep the price low until shale producers find it too expensive to continue operating—was joined by a December report from the International Energy Agency (IEA)* forecasting a decline in Oil demand in 2016. The combined effect of more production in the face of lower demand goes against the lessons learned in microeconomics, and cannot continue forever. In the meantime, maybe it’s best to just enjoy filling up the tank at $2 a gallon.

Outlook

It seems that lately an outlook based upon the previous quarter becomes stale almost instantaneously as the new quarter begins. This has never been more true than at the current moment. The first week of trading in 2016 was a dud with the worst opening week return in the history of the S&P 500. Much of the blame is being pointed in the direction of China, where nervousness about the country’s economic growth was validated by weaker-than-expected manufacturing numbers released last week.

Since concerns over lower economic growth coupled with a price disruption in the oil market are shouldering much of the blame, a quick flesh out of those issues is appropriate.

Global Economic Growth

The key measure in growth is Gross Domestic Product (GDP)*, which is widely used as the litmus test to determine the health of economies. Over the past three years, GDP growth has flattened across the globe, with the most notable declines occurring the in the developing economies such as China. Developing economies such as China are inherently prone to slowdowns in growth as they mature and move away from construction and manufacturing and towards services-based industries. Fits and starts are a natural result of this process and we are currently in a moment where consensus says China overindulged in a construction spree leaving investors holding the bag.

Oil Prices

Since the time of the Industrial Revolution, most drops in oil prices have been seen as a harbinger of good news. Driving becomes cheaper, transporting goods is cheaper, running machinery and factories are cheaper. Today, it seems as though gas under $2 is barely registering as a bright spot to investors. Few oil producers can make a consistent profit with oil prices at current levels. If supply levels do not decrease and demand does not show any increases, we may see some companies fail. However, in the face of lower demand growth, many neglect to mention that consumption of oil has never been higher than it is today.

Certainly in the short term both issues could continue to have serious effects for markets world-wide, but it is more important to take a holistic look at the long-term emerging financial landscape. While swift market declines and volatility evoke knee-jerk bad memories of 2008, today’s economy faces different issues and it is too soon to tell whether we are on the cusp of a global slowdown. Despite familiar headlines, the current situation is unique and unprecedented—we’ll have to see what unfolds in the coming months.

Glossary

*Federal Funds Rate – Interest rate used by the largest banks to lend money in the shortest time periods, usually overnight

*OPEC – The Organization of the Petroleum Exporting Countries. A group of major oil producing nations that collude to set production levels. OPEC produces approximately 40% of the world’s oil supply.

*IEA – The International Energy Agency. An inter-governmental agency founded in the mid 1970’s to promote energy security, economic development and environmental protection among non-OPEC countries.

Gross Domestic Product – The broadest quantitative measure of a nation’s economic activity. The equation is Consumption + Government Expenditures + Investment + (Exports – Imports)

† Indices used to represent asset classes:
U.S. Large Cap Stocks – S&P 500
U.S. Small Cap Stocks – Russell 2000
International Stocks – MSCI ACWI ex-U.S.
U.S. Bonds – Barclays Aggregate
Commodities – Bloomberg Commodity

IMPORTANT INFORMATION

The information presented here is not specific to any individual’s personal circumstances.

To the extent that this material concerns tax matters, it is not intended or written to be used, and cannot be used, by a taxpayer for the purpose of avoiding penalties that may be imposed by law. Each taxpayer should seek independent advice from a tax professional based on his or her individual circumstances.

These materials are provided for general information and educational purposes and represents Wilson Capital’s views based upon publicly available information from sources believed to be reliable—we cannot assure the accuracy or completeness of these materials. The information in these materials may change at any time and without notice.

Wilson Capital is a Registered Investment Advisor (“RIA”), registered in the state of Massachusetts. Wilson Capital provides asset management and related services for clients nationally. Wilson Capital will file and maintain all applicable licenses as required by the state securities boards and/or the Securities and Exchange Commission (“SEC”), as applicable. Wilson Capital renders individualized responses to persons in a particular state only after complying with the state’s regulatory requirements, or pursuant to an applicable state exemption or exclusion.

Click here to download the Investment Letter PDF: 4Q15-Investment-Letter-Final-011816.pdf (526 downloads)